
Sherlok Blog
Practical insights on data, AI and marketing.

Break-even point: how to calculate all 3 types, with examples
Learn how to calculate the accounting, cash and economic break-even point with agency and e-commerce examples, and why your ad budget can shift the result by almost 80%.
Read article →
How to use Looker Studio and where it breaks (now Data Studio)
An honest guide to Looker Studio, now renamed Data Studio again: how to build your first dashboard, where it breaks (GA4 quotas, blends, paid connectors) and when it makes sense to move on.
Read article →
Data literacy: how to build a team that reads numbers
Data literacy means reading, questioning and deciding with data. Here are the 4 levels, the 5 questions that catch most reading errors, and what leaders need to do.
Read article →
CPM vs CPC vs CPA vs CPL: differences and when to use each
CPM, CPC, CPL and CPA are not four separate metrics: each one is the previous divided by a rate. See the formulas, worked examples and how to use the chain to diagnose a rising CPA.
Read article →
Black Friday 2026: how to prepare your online store with data
At Black Friday 2025, Brazilian ecommerce shipped more orders at a lower average ticket. Here is the October checklist for 2026: history, inventory, discounted break-even ROAS and audience warm-up.
Read article →
AI agent vs chatbot: the difference that matters
76% of Brazilian companies say they run AI agents in production, yet only 18% have wired them into workflows. The difference between an agent and a chatbot explains the gap.
Read article →
Customer retention rate: formula and how to calculate it
The formula fits on one line, but the mistake lives in the denominator: counting new customers inflates the number and hides the leak. Here is how to calculate it, which window to use and what to do next.
Read article →
Machine learning: what it is and how it works
You already use machine learning in four or five places without ever calling it an AI project. How a model learns, where it is already running in your business, and when it pays to train your own.
Read article →
Digital marketing dashboard: how to build yours
A panel with 28 cards and nobody decides anything. The structure that works starts from the decision, moves down to the funnel stage, and only then picks the metric. With a stage-by-stage table, a worked example and the usual mistakes.
Read article →
How to show up in ChatGPT: 3 doors and how to measure
There is no sign-up form for ChatGPT. There are three entry points, a crawler you may be blocking by accident, and three layers of measurement that almost nobody tracks.
Read article →
How to Calculate CTR: Formula and Benchmarks by Channel
CTR is the easiest metric to calculate and one of the easiest to misread. Here is the formula, what changes the denominator in each channel, and current benchmarks with sources.
Read article →
Data maturity: what level is your company at?
Your company's data maturity is not in the tool you bought. It is in how long it takes to answer one hard question, and how much you trust the answer. A quick test and the five levels explained.
Read article →
GA4 Website Metrics: What Actually Deserves Tracking
GA4 bounce rate is not the Universal Analytics one. Here is how engaged sessions work, which website metrics to track every week and where each of them quietly misleads you.
Read article →
Cohort analysis: how to read the table nobody reads
An average retention rate hides customer intakes that behave nothing alike. Cohort analysis separates them and shows where acquisition and onboarding actually fail.
Read article →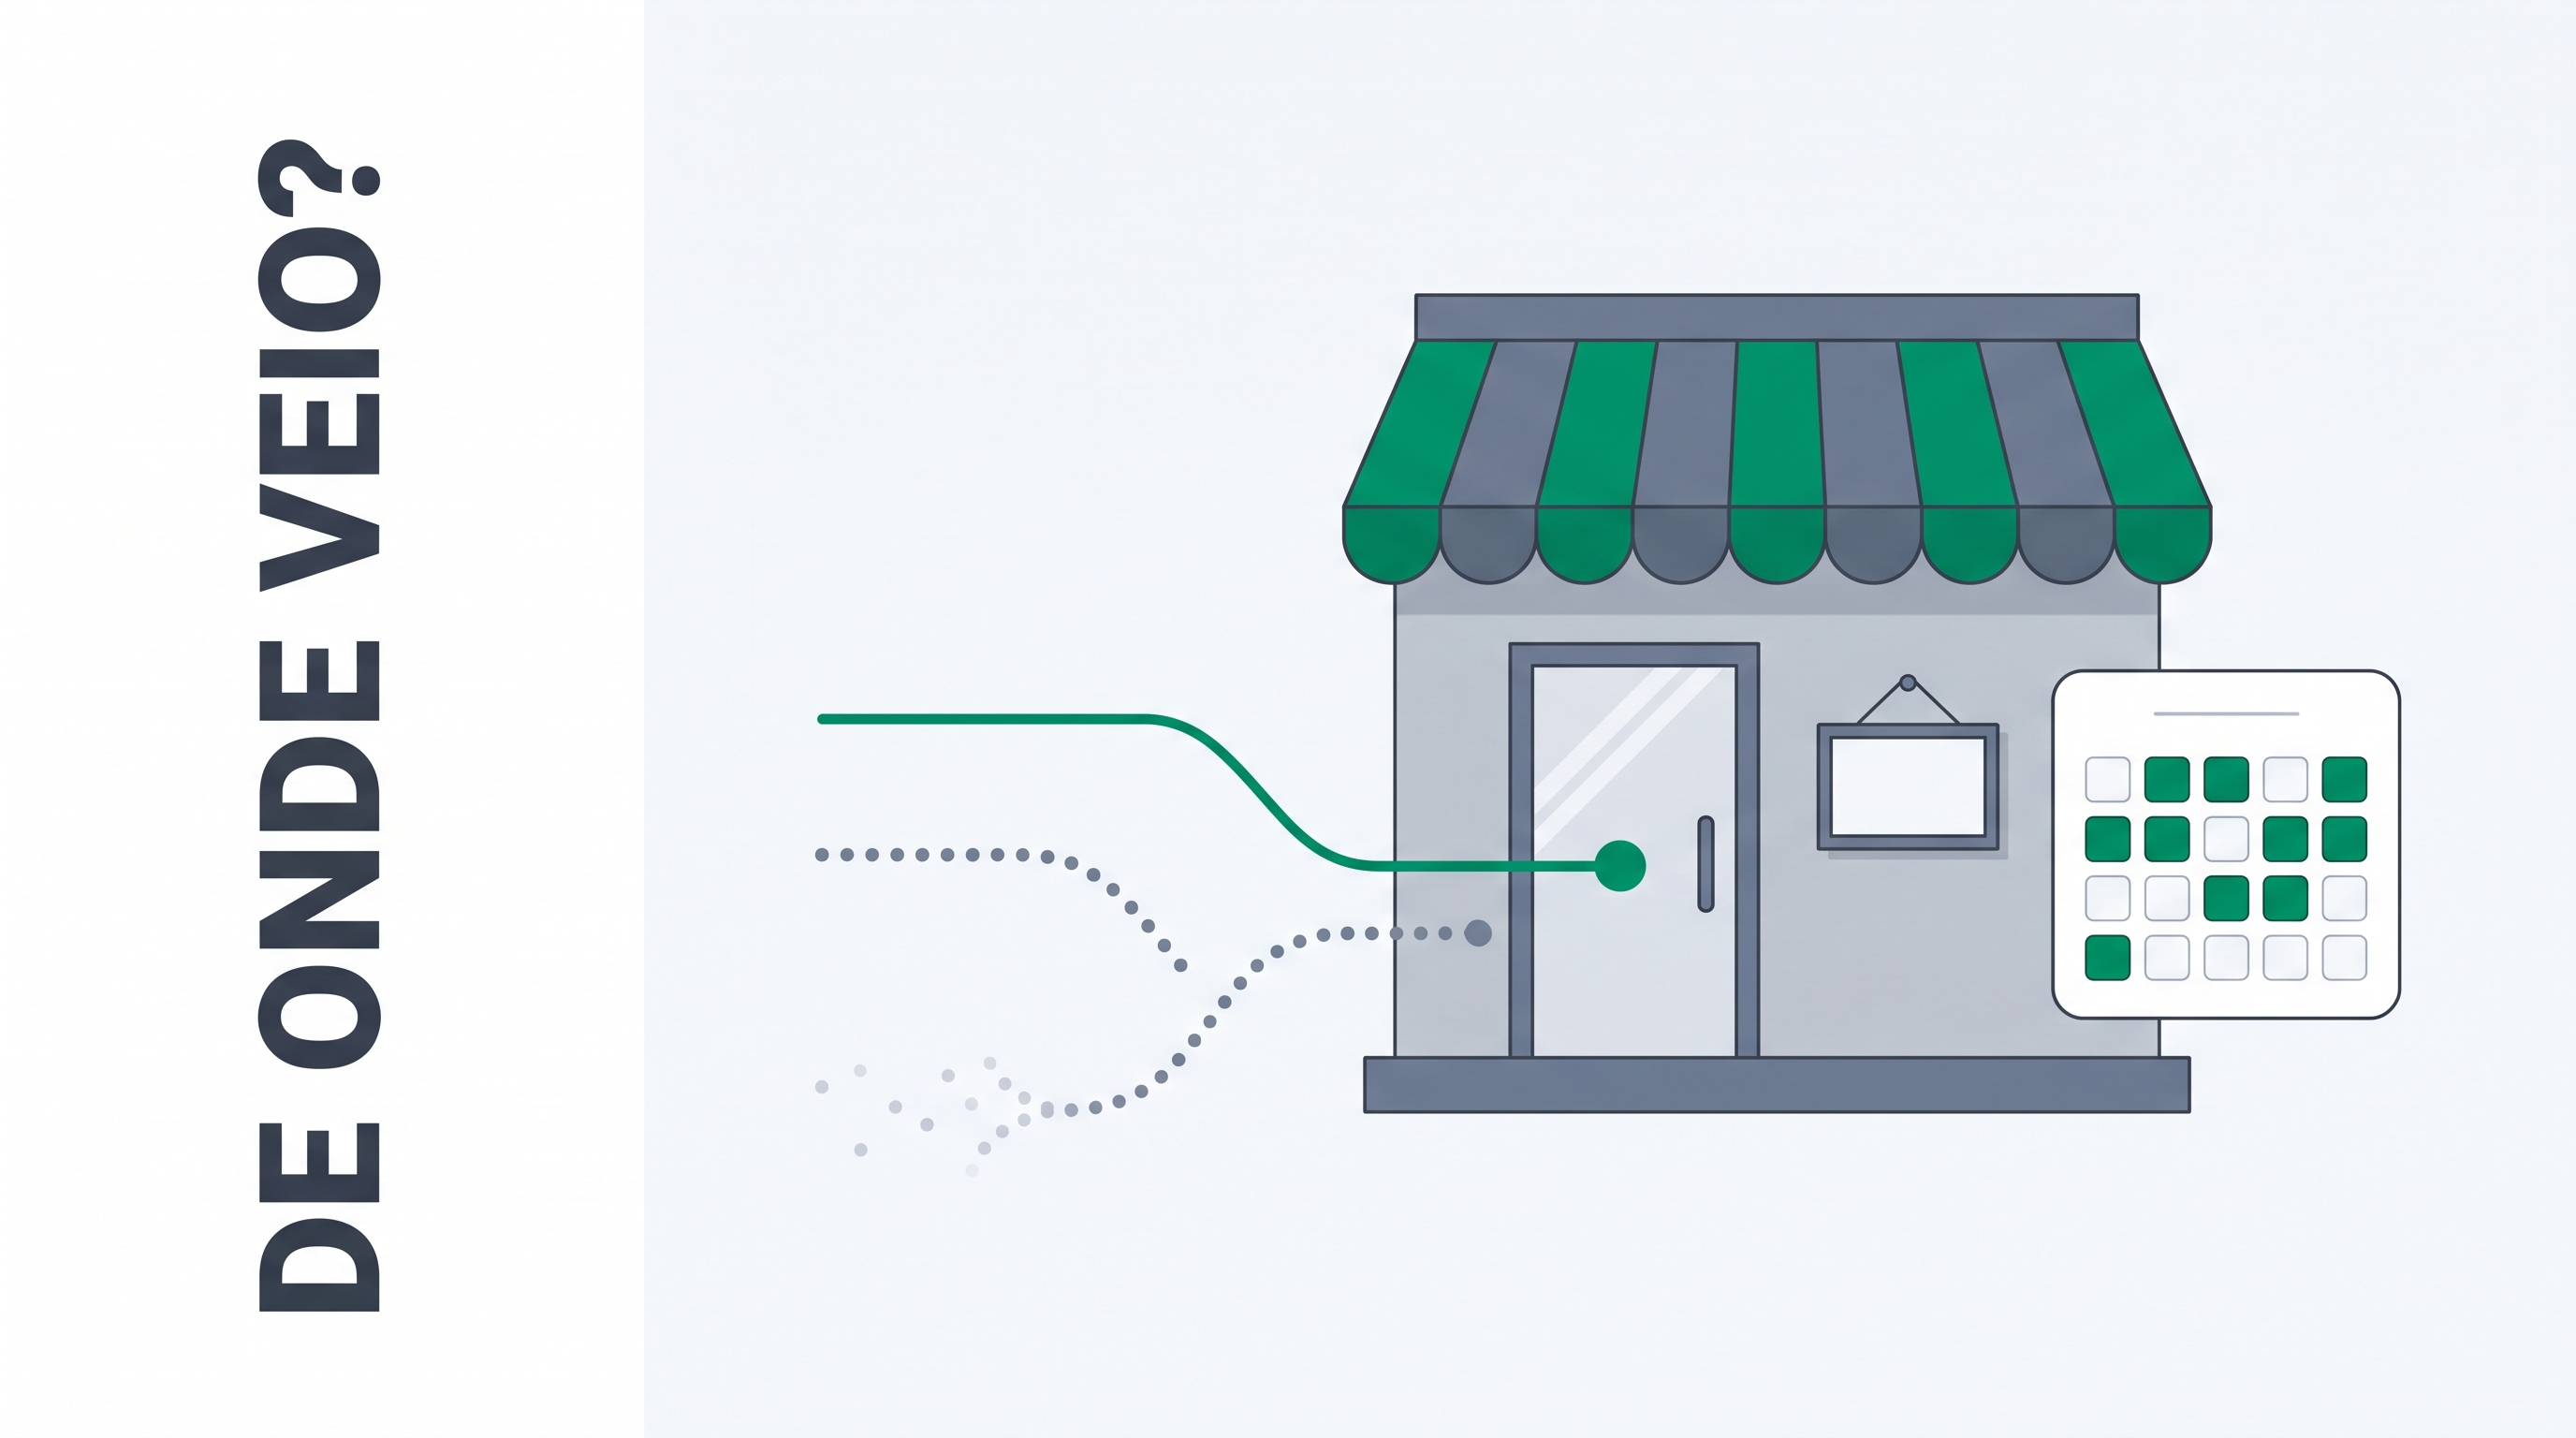
Local business data: the basics almost nobody tracks
A local business does not need data engineering, it needs four records. Customer source, schedule utilization, revenue by service and cost per new customer, with worked examples.
Read article →
Agency reporting template: section by section
The reporting template agencies use to answer the client's question in the first paragraph: seven sections explained, the mistake that shows up in each one, and an example with the math closed out.
Read article →
Predictive Analytics: What It Is and How to Apply It
Forecasting churn, demand or purchase intent no longer requires hiring a data scientist. What predictive analytics actually does, where it breaks, and how to start with the data you already have.
Read article →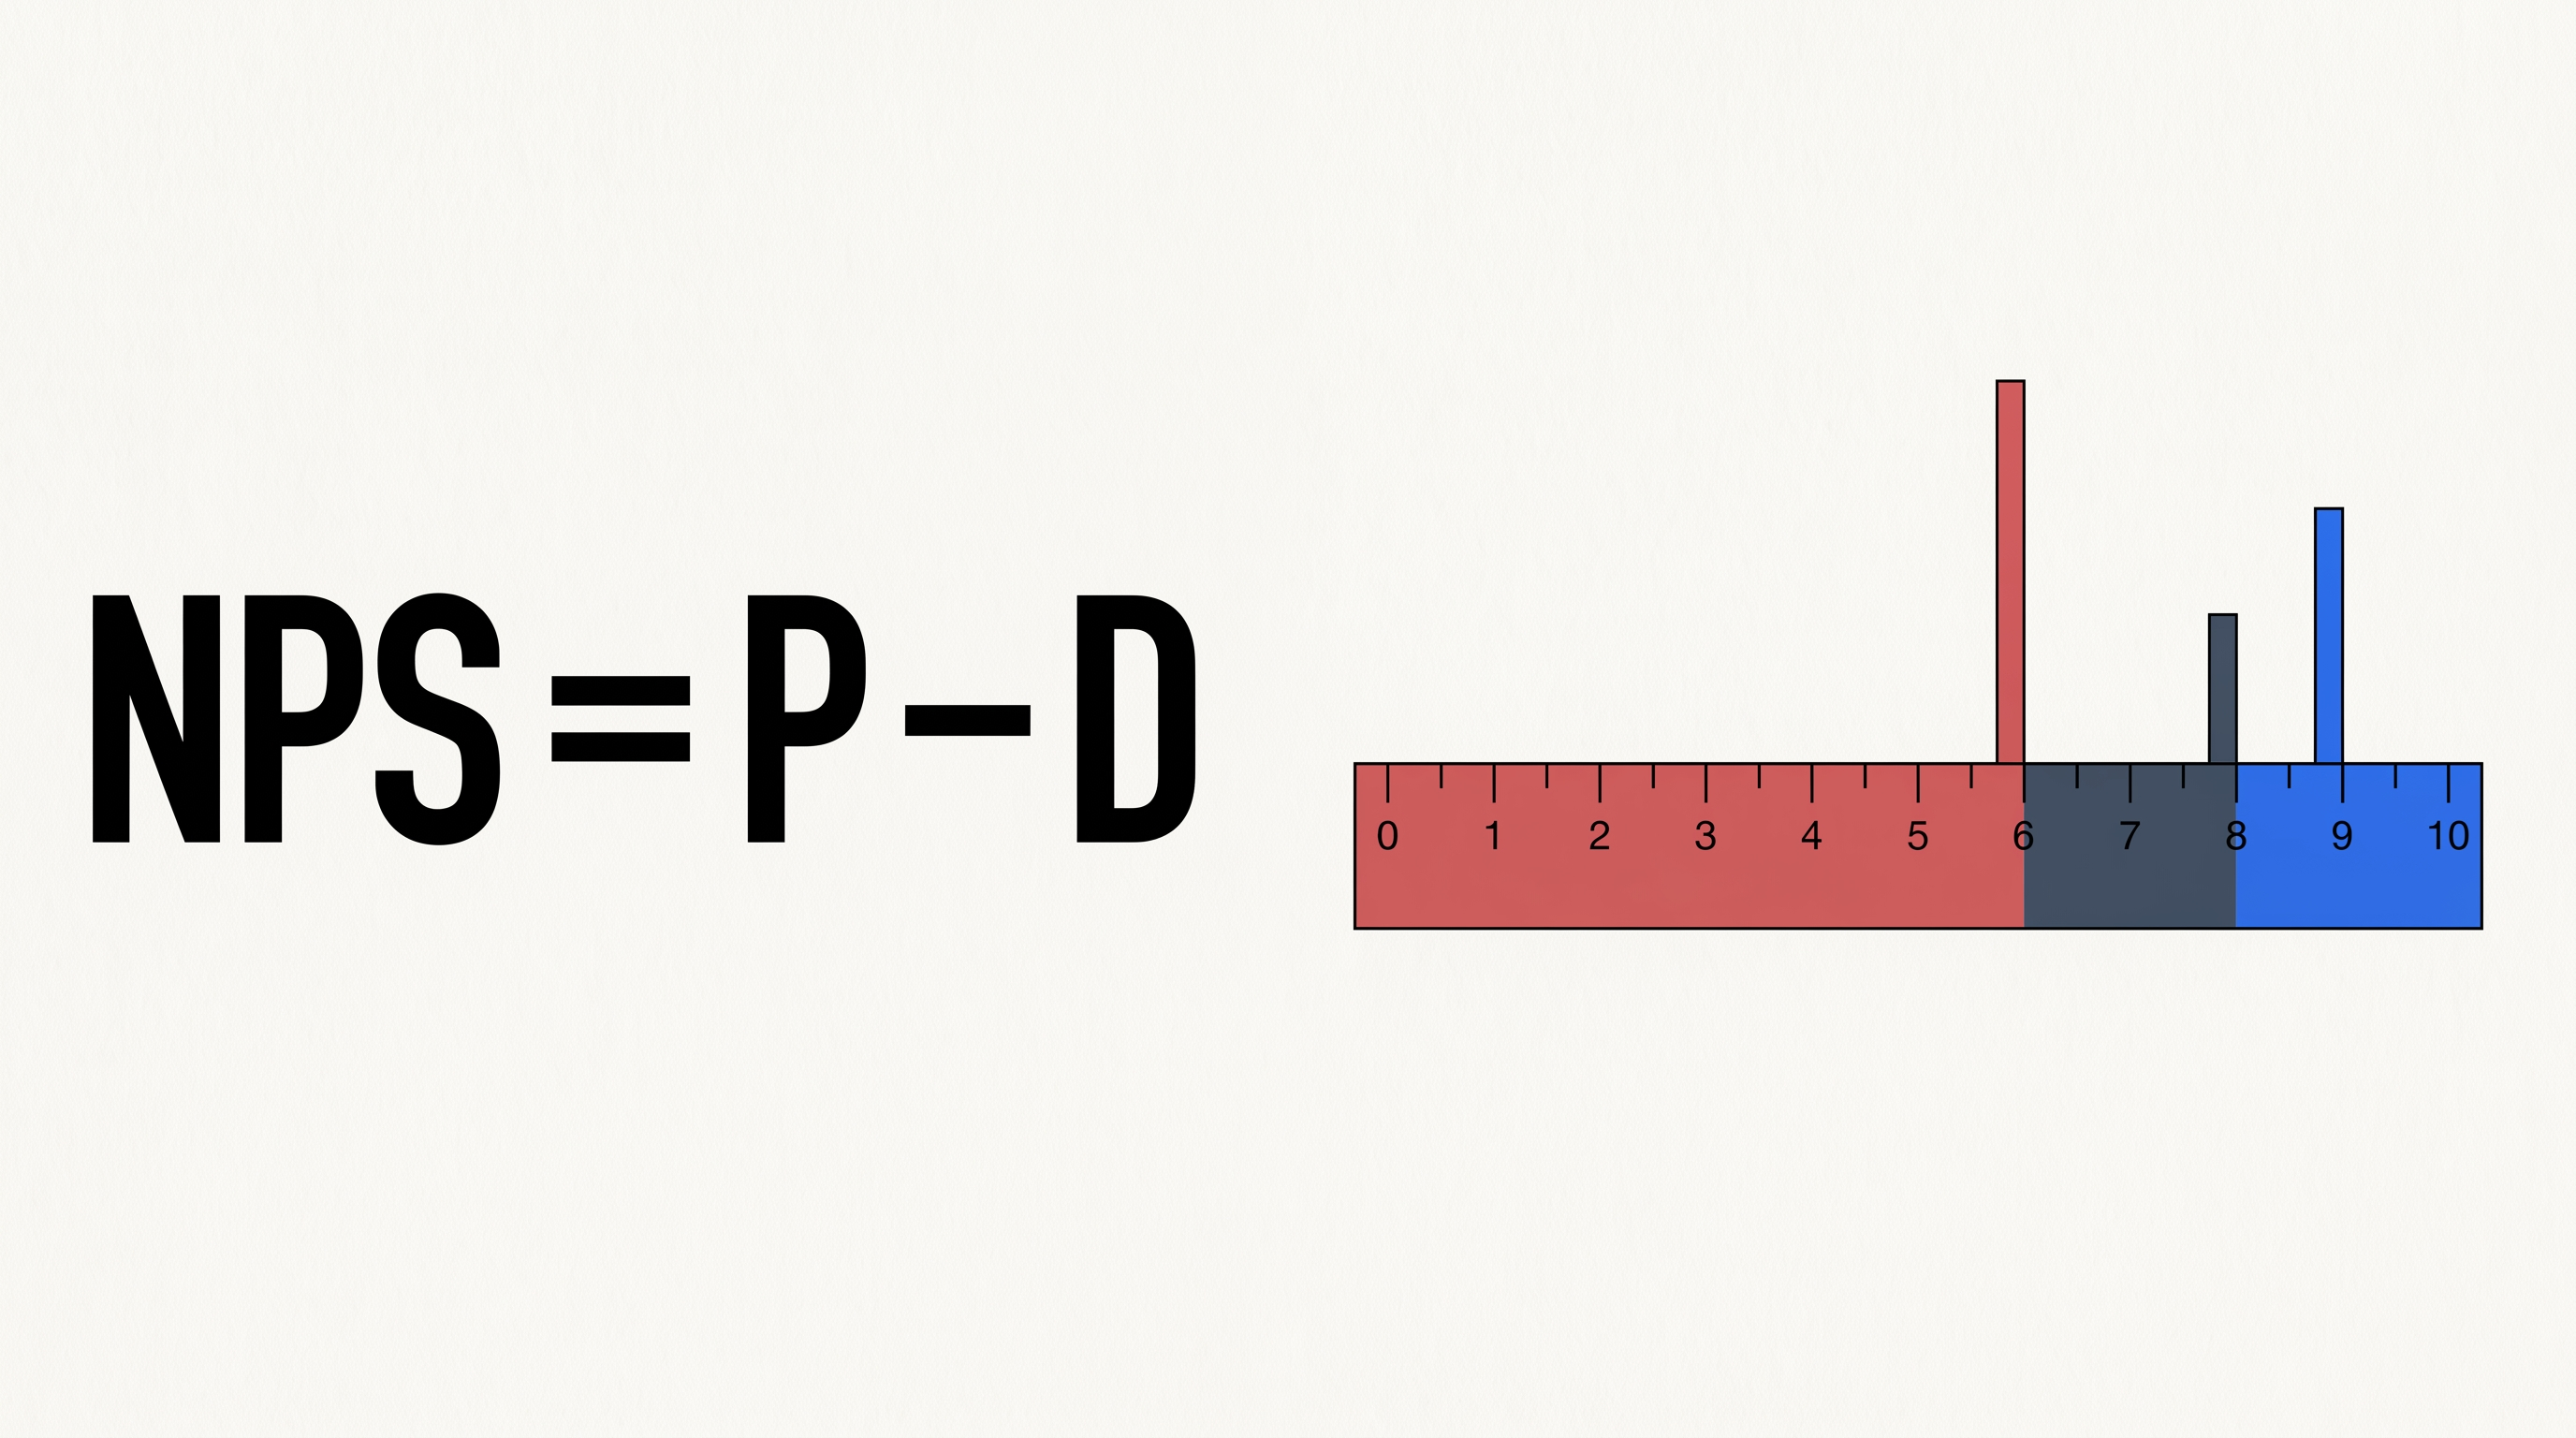
NPS: how to calculate, read and act on the score
The NPS formula fits on one line. The hard part comes after: knowing whether 40 is good, understanding why it moved, and deciding what to do with promoters, passives and detractors.
Read article →
Data-driven meetings: rituals that produce decisions
Most metrics meetings end without a single decision. The problem is rarely missing data: it is how the ritual is designed. Here is how to build the agenda, cadence and metrics that lead to decisions.
Read article →
Data warehouse: what it is and when you need one
Most companies asking about a data warehouse do not need one yet. Here are the concrete signs it is time, what it really costs, and how to start without stalling.
Read article →
How to Analyze Google Ads Campaigns: The Right Order
Your dashboard can be all green while the sales team complains about lead quality. Here is the diagnostic order that shows where your Google Ads campaign actually loses money, layer by layer.
Read article →
Contribution margin: how to calculate and use it
Contribution margin is what's left from each sale after variable costs. The formula, a worked example, and how it sets your break-even point, CAC ceiling and minimum ROAS.
Read article →
Why Did Sales Drop? A 6-Step Data Diagnosis
When sales fall, the discussion starts with the causes that are easiest to blame. A 6-step elimination method to find the real one in a single morning, using data you already have.
Read article →
OKR vs KPI: The Difference and How to Use Both
A KPI is the thermometer, an OKR is the treatment plan. The practical difference between them, with examples by department, a real scored cycle, and the mistakes that kill adoption by quarter two.
Read article →
Data analysis questions: 30 examples by department
30 ready-to-use data questions for marketing, sales and finance, plus the anatomy of a good question and the mistakes that leave analysis without a decision.
Read article →
Data Quality: The Silent Errors Skewing Your Analytics
Duplicate CRM records, broken tracking and mismatched field formats distort your metrics without warning. Here is how to audit your data quality.
Read article →
How to Analyze Meta Ads Campaigns: Metrics That Matter
A three-layer diagnosis method for analyzing Meta Ads: campaign, ad set and creative. With real benchmarks and a full numerical example.
Read article →
Average Order Value: How to Calculate and 8 Ways to Raise It
The AOV formula, the slices the average hides, and 8 practical tactics to raise spend per order without sacrificing conversion or margin.
Read article →
Data democratization: access without depending on IT
Giving teams data access without depending on IT is not about opening everything to everyone. See how to balance autonomy and light governance, with practical steps.
Read article →
Retail data analysis: 7 practical use cases
Seven data analysis use cases retailers can apply today: stockouts, seasonality, pricing, ABC analysis and local campaigns, with worked examples.
Read article →
UTM: what it is and how to track campaigns properly
UTM parameters identify where every visit comes from. Learn what they mean, how to build trackable links, and the mistakes that dump your sales into "direct".
Read article →
Is Power BI Worth It? Alternatives and Comparison for SMBs
Power BI is excellent, but it charges a price that never shows up on the invoice: time and technical people. See real costs, alternatives, and when it makes sense for an SMB.
Read article →
AI Agents: What They Are and What They Change for Business
AI agents plan, execute, and verify tasks on their own, a very different animal from a chatbot. See how they work, real data use cases, and the adoption numbers.
Read article →
Conversion Attribution: Where Your Results Really Come From
Meta says one thing, Google another, your CRM a third. Learn how conversion attribution works and how to make budget decisions without fooling yourself.
Read article →
SaaS Metrics: MRR, Churn, NRR and What Investors Look At
A pocket guide to SaaS metrics: formulas for MRR, churn, NRR, CAC and payback, worked examples and the benchmarks investors actually use to evaluate your operation.
Read article →
Excel's row limit: when spreadsheets stop keeping up
Excel holds 1,048,576 rows, but the limit that stalls companies arrives much earlier. The operational signs your business has outgrown spreadsheets.
Read article →
Cost per lead: how to calculate CPL and what's a good one
The CPL formula fits in one line, but the number only means something next to CAC and customer conversion. Here is how to calculate it, compare it by channel, and lower it well.
Read article →
Dashboards vs. Reports: The Difference and When to Use Each
A dashboard shows what is happening; a report explains why and what to do next. Here is when to use each one, plus the four mistakes teams make most often.
Read article →
How to use AI in digital marketing: 9 real applications
Generating copy is just the first step: 9 real applications of AI in digital marketing, from segmentation to budget allocation, and which one to prioritize.
Read article →
Conversion Rate: How to Calculate and Improve It by Channel
The conversion rate formula with worked examples, Brazilian benchmarks by industry and a practical checking order to diagnose drops before changing anything.
Read article →
Data silos: why your company is deciding in the dark
Does every team in your company have a different number for the same question? That's a symptom of data silos. Here's what this fragmentation really costs and the practical paths to unify your data.
Read article →
Instagram Metrics: How to Analyze Them (and What to Ignore)
Learn to read Instagram metrics in three layers: reach, engagement and action. What to track in Business Suite, what a good rate looks like and what to skip.
Read article →
Client results reports: how agencies should present them
How agencies should present results to clients: a 4-block structure, business metrics up front, and automated data collection, with worked examples.
Read article →
Key Financial Metrics for Small Businesses: The Essentials
Contribution margin, break-even point, and cash flow: the three financial metrics that decide whether a small business grows or fails, with worked examples.
Read article →
AI for Sales: Practical Uses Beyond the Hype
Lead prioritization, forecasting and pipeline analysis: what AI for sales really solves, with worked numbers and the prerequisites nobody mentions.
Read article →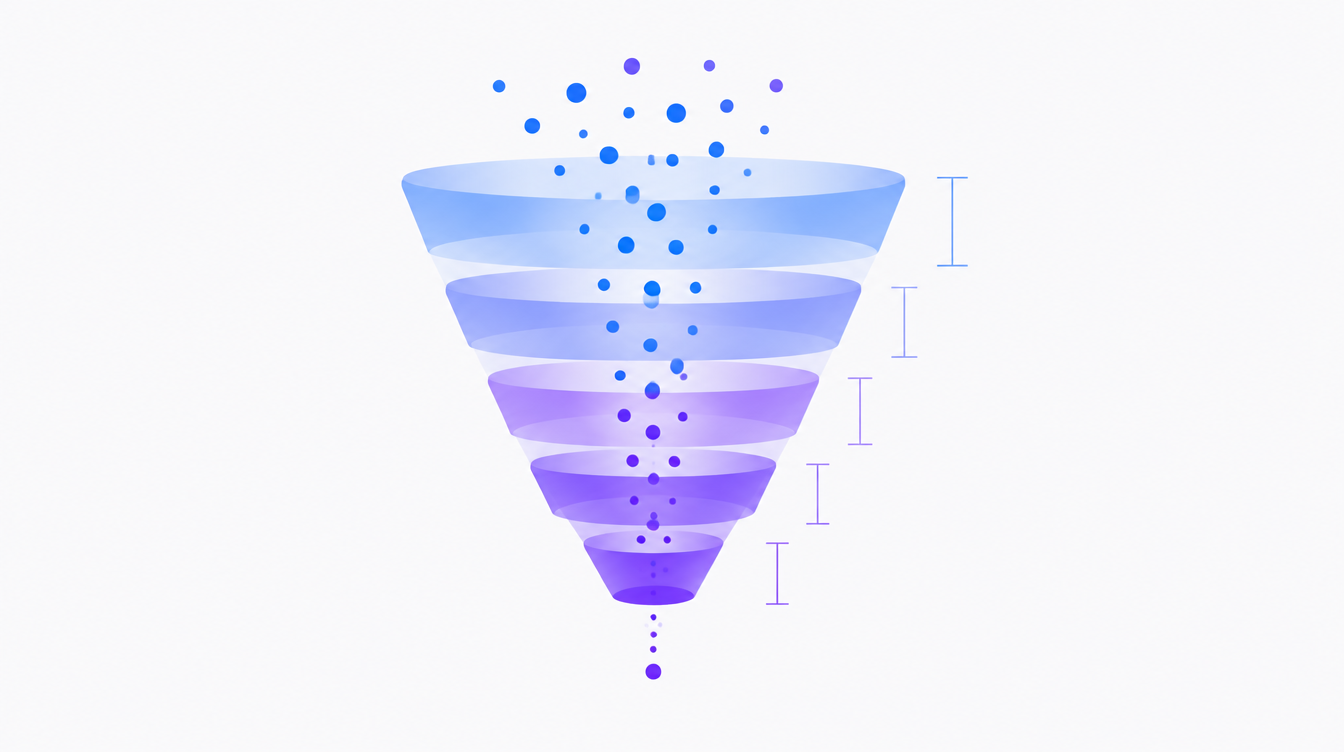
Sales Funnel: How to Build and Measure Every Stage
Learn how to build a data-driven sales funnel: stages, passing criteria, per-stage conversion rates, and how to spot bottlenecks before they get expensive.
Read article →
ROI vs ROAS: The Difference and When to Use Each
ROAS measures revenue per dollar of ad spend; ROI measures profit after all costs. With worked examples, see when a ROAS of 4 hides a loss and how to set a real target.
Read article →
Data Integration Between Systems: API, CSV, or ETL?
Manual CSV, direct API, or an ETL pipeline? Compare the costs, limits, and use cases of each data integration path and choose based on the decision your data needs to support.
Read article →
How to Create a Marketing Report: Template and Step-by-Step
A ready-to-use structure, six steps, and the right cadence for a marketing report leadership actually reads: fewer screenshots, more analysis and recommendations.
Read article →
Brazilian E-commerce in 2026: The Data That Matters
Brazilian e-commerce is growing at double digits, but the numbers diverge depending on who measures. See the 2026 data that matters and how to use it in your operation's decisions.
Read article →
Churn Rate: How to Calculate and Reduce Customer Attrition
A 5% monthly churn means losing 46% of your customer base in a year. Learn how to calculate churn rate, compare against real benchmarks and act on early signals.
Read article →
How Google Analytics 4 Works: Events, Reports, and Limits
Understand how GA4 actually works: the event model, the reports worth your time, and the retention and sampling limits that shape every analysis you run.
Read article →
Data-Driven: What It Actually Means in Practice
Data-driven means deciding based on data, not opinion or hierarchy. Here are the signs your company actually runs on data (or doesn't) and the first steps for the next 90 days.
Read article →
How to Calculate ROAS: Formula, Break-Even ROAS, Real Targets
ROAS is revenue divided by ad spend, but the number only means something next to your margin. Here is the formula, the break-even ROAS math, and how to set realistic targets on Meta and Google Ads.
Read article →
AI Sales Forecasting: How It Actually Works in Practice
From history to forecast: how AI models project your sales, how accurate they really are, and a realistic way to get started without hiring a data scientist.
Read article →
Sales dashboard examples and what yours must include
Sales dashboard examples by context, the six indicators no panel can miss, the three-layer structure and the design mistakes that turn dashboards into expensive decoration.
Read article →
What Is ETL? Extract, Transform, Load Explained Simply
ETL is the process that pulls data from different systems, standardizes it, and lands it in one place for analysis. How it works, ETL vs. ELT, and when you need it.
Read article →
How to Calculate LTV: Formulas, Examples and the LTV/CAC Ratio
LTV tells you what a customer is worth over their entire relationship with your business. See the formulas, worked examples, and how the LTV/CAC ratio sets your acquisition budget.
Read article →
Digital Marketing KPIs: What to Measure at Each Funnel Stage
Ad spend keeps climbing while most teams still fly blind. Here are the digital marketing KPIs worth tracking at each funnel stage, with formulas and worked examples.
Read article →
Paid Traffic Metrics: What to Track and What to Ignore
CPM, CPC, CTR, CPL, and ROAS measure different things, and optimizing the wrong one gets expensive. See the right metric hierarchy for each paid campaign objective.
Read article →
CAC: What It Is, How to Calculate It, and What's Good
CAC is what you pay for every new customer. See the formula, a fully worked example, and the benchmarks that tell you whether your number is healthy.
Read article →
Data-Driven Decisions: A Practical Guide for Modern Businesses
Understand how data analysis, KPIs, and visualizations guide data-driven decisions to reduce risks and align strategies.
Read article →
Business Process Automation: A Practical Guide and Applications
Discover how automation integrates data and uses artificial intelligence to simplify processes and improve business decisions.
Read article →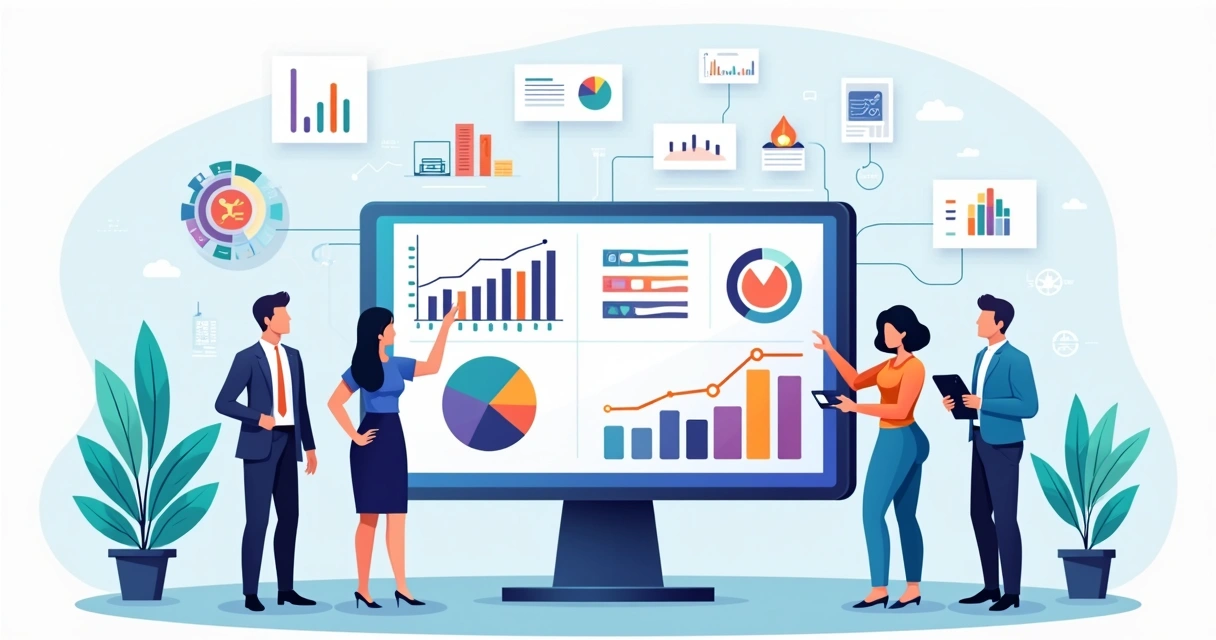
Best Data Analytics Tools for Businesses
Compare the best data analytics tools to integrate systems, automation, machine learning and visualization in your company.
Read article →
Sherlok AI: How to Integrate Data & Extract Insights Without Coding
Discover how Sherlok AI integrates data from CRMs, ads, and spreadsheets, generating reports and insights without requiring programming.
Read article →
Practical Guide: Data Analysis with Artificial Intelligence
Discover how AI automates data analysis, integrating systems and generating insights for efficient strategic decisions.
Read article →
Data: A Practical Guide for Smart Business Decisions
Learn to differentiate data types, integrate sources, and use AI for decisions based on business analysis and insights.
Read article →
How Data and AI Drive Business Decisions
Understand how data and AI generate insights, automate processes, and support strategic decisions in business environments.
Read article →
Practical Guide to Data AI: Industrial Applications
Discover how data AI for industries improves maintenance, automation, quality, and supply chain, reducing costs.
Read article →
Practical Guide: AI in Business Decision-Making
Discover how AI integrates CRM, marketing, and banking data to generate automatic analyses and recommendations without coding.
Read article →
How Sherlok Transforms Data into Strategic Decisions
Discover how Sherlok integrates data from various sources and uses AI for analysis, alerts, and quick strategic decisions.
Read article →
Data AI for Agencies: How to Integrate, Analyze, and Act
Discover how data AI for agencies integrates systems, automates reports, and empowers effective, segmented decisions.
Read article →
Sherlok: Integrated Data Analysis with Artificial Intelligence
Sherlok integrates SEO, CRM, and marketing data, generating automatic analyses and recommendations without the need for programming.
Read article →
Assertive Data-Driven Decisions: A Practical Guide for Leaders
Learn to structure strategies, interpret data, and leverage BI and AI for assertive data-driven decisions in the business environment.
Read article →
NEON Sebrae: How the Event Boosts Startups and Innovation
The NEON Sebrae event connects startups, investors, and technology, fostering innovation and partnerships in the Northeast of Brazil.
Read article →
How to apply AI in data analysis for business decisions
Discover how AI data analysis integrates CRMs and databases, generating predictive and prescriptive insights for decision-making.
Read article →
How Sherlok integrates data for assertive decisions in companies
top of page
Read article →
What is Sherlok AI and how to integrate data into your company?
In this article, you will see a detailed demonstration of how Sherlok automates the approval of medical expense reports (for reimbursement or payment of advances).
Read article →
Data Intelligence: Practical Guide for Business Decisions
Oasis for the mind and for the soul. The new Sherlok website is a testament to the fact that it is possible to create a digital experience that goes beyond mere functionality, becoming a true retreat for those seeking peace and inspiration.
Read article →
How much data will be created per day in 2026? Impacts and trends
Page top
Read article →
Practical Guide to Analyzing Digital Marketing Data
Mais sobre Sherlok
Read article →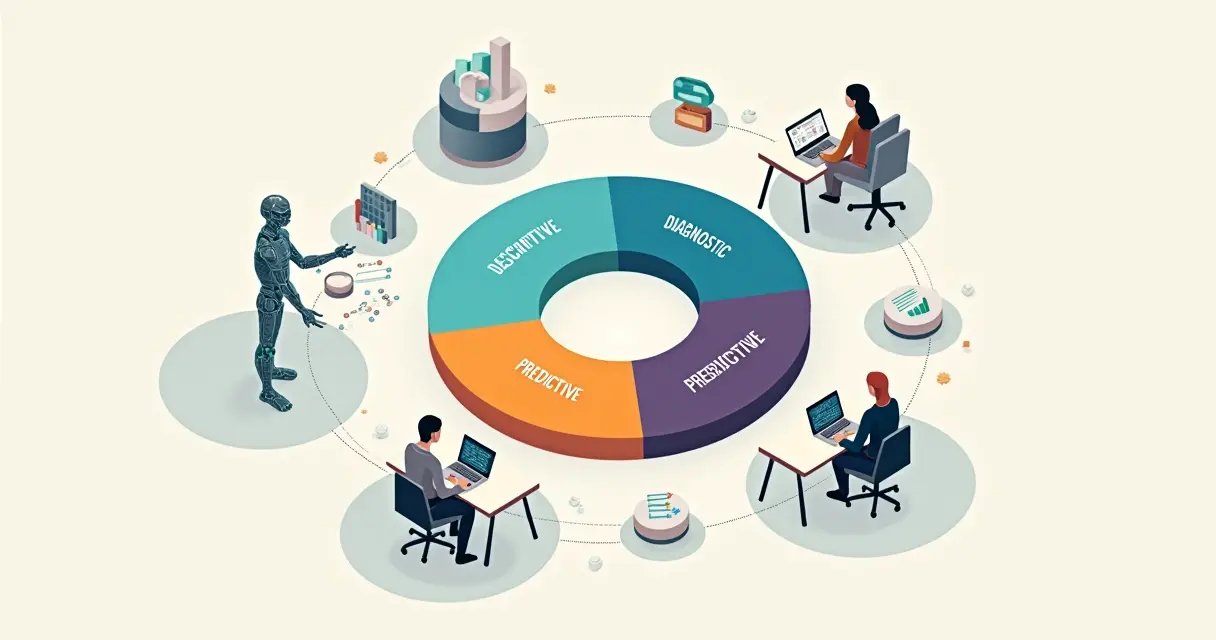
AI for Data Analysis: A Practical Guide for Businesses
Cabeçalho
Read article →
5 Signs Your Company Needs to Integrate Data Now
Cabeçalho
Read article →
How AI Enhances Paid Traffic Campaigns
Home
Read article →
How to connect marketing, sales, and finance without wasting time
top of page
Read article →
Decide fast or decide right? How to do both with AI
Sherlok - the smart way to explore the internet.
Read article →
Data culture: how to put discourse into practice
topo da página
Read article →
Main data management errors that hinder growth
Sherlok: Sua Casa e Você no Topo da Página
Read article →