How to use Looker Studio and where it breaks (now Data Studio)
If you work in marketing, you have probably received a Looker Studio link at 9 a.m. on a Monday with the message "check the dashboard". And you have probably opened that link to find half the charts showing an error instead of numbers. Both moments tell the same story: the tool is excellent for getting started, and it sends the bill once your operation grows.
First, a detail many people still miss: in April 2026 Google gave the product its old name back. Looker Studio is Data Studio again, and the paid tier is now Data Studio Pro. Reports, links and data sources kept working with no migration. I use both names here, because that is still how people search for it.
How to use Looker Studio, in short: sign in with a Google account, create a blank report, connect a data source (GA4, Google Ads, Sheets, BigQuery or a partner connector), drag charts onto the canvas, set dimensions, metrics and a date range control, then share the link. The free version handles dashboards with one to three sources well; the limits show up in API quotas and data blending.
What Looker Studio is and why it is called Data Studio again
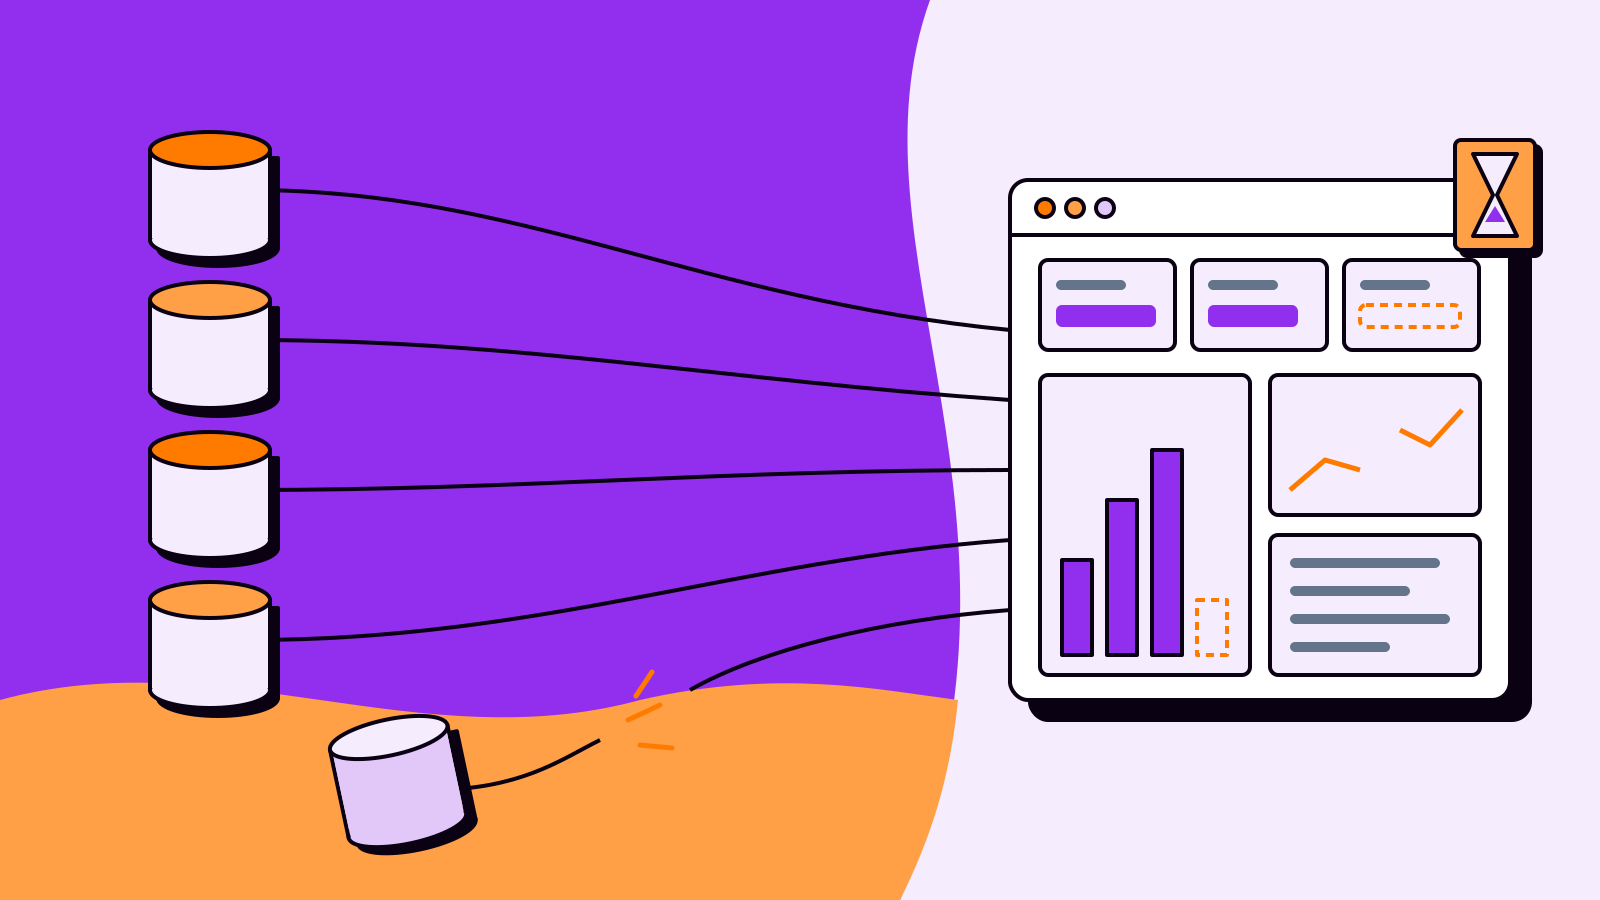
It is Google's free data visualization tool. It does not store data on its own: it reads from wherever the data lives, every time someone opens the report, and draws charts on top. That is both its strength and its weakness.
The naming history is confusing. The product launched as Data Studio in 2016, became Looker Studio in 2022 after Google bought Looker, and went back to Data Studio on April 16, 2026, according to the official release notes. The stated goal is to separate the self-service tool from Looker, the enterprise BI platform with LookML modeling, which keeps its name. If you already use it, nothing breaks.
How much does Looker Studio cost?
The standard version is free for creators and viewers. The Pro tier costs US$9 per user, per project, per month, according to Google Cloud's official pricing page. Look at what Pro actually solves: governance (reports belong to the company, not to the employee who left), team workspaces and AI features. It does not raise your GA4 API quota, which is set on the Analytics side. Third-party connectors, such as the ones that pull Meta Ads, are billed separately by each vendor.
How to use Looker Studio: building your first dashboard
The flow has four layers: source, connector, report and sharing. Knowing where each one ends saves a lot of headaches, because each layer has its own breaking point.
- Create the report. In Looker Studio, click Create, then Report. The blank canvas asks for a data source right away.
- Connect the source. Google's own connectors (GA4, Google Ads, Search Console, Sheets, BigQuery) are free and ready in minutes. For Meta Ads, TikTok or a CRM you will need a partner connector, almost always paid, or a spreadsheet in between.
- Check the fields. Before drawing a single chart, open the data source and check the types: date as date, revenue as currency, rates as percent. A type mistake here becomes an average of percentages later, the most common error in marketing dashboards.
- Lay out the page. Scorecards at the top, a time series in the middle and detail tables at the bottom. Add a date range control and turn on comparison with the previous period.
- Create calculated fields. CPA, ROAS and conversion rate must be a ratio of sums, such as SUM(Cost)/SUM(Conversions), never the average of a column that is already a ratio.
- Share carefully. Decide whether the report uses the owner's or the viewer's credentials. With owner's credentials, anyone with the link sees the data you see.
If this is your team's first dashboard, decide what goes into it before you open the tool. We cover that in how to build a digital marketing dashboard. The tool is the easy part; picking the right five numbers is the hard one.
Where does Looker Studio break?
This is the part most tutorials skip. The bottlenecks are predictable, and almost all of them share one root cause: Looker Studio queries the source live instead of keeping a copy of the data.
1. The GA4 API quota
Every chart connected to GA4 is an API query, and the API has a ceiling. According to the GA4 Data API quota documentation, a standard property gets 200,000 tokens per day, 40,000 per hour, 14,000 per project per property per hour and at most 10 concurrent requests. In practice, every Looker Studio report pointing at the same property competes for those limits.
A simulation gives you the order of magnitude. A dashboard with 25 charts using an average of 15 tokens per query spends about 375 tokens each time someone opens it or changes a filter. With 14,000 tokens per hour, that is roughly 37 interactions per hour before the error, across everyone. An agency with ten people poking at a client's dashboard on Monday morning gets there fast.
The usual workarounds: fewer charts per page, the Extract Data connector (which caches a slice of the data) or GA4's native export to BigQuery. They work, but each one adds another piece to maintain.
2. Limited data blending
To combine sources, Looker Studio uses blends. Per the official documentation, a blend accepts at most five sources, with inner, left, right, full outer and cross joins. That handles Google Ads plus GA4 by date. It breaks when you need to join ad spend, CRM and finance by campaign, because the keys rarely match: the campaign name in Meta is not the UTM, which is not what the CRM stores.
3. Slowness at volume
Spreadsheets with tens of thousands of rows and direct queries on large tables make every filter slow. The usual fix is a data warehouse in the middle, typically BigQuery, with the dashboard reading pre-aggregated tables. That fixes speed but changes the size of the project: now someone owns a pipeline, a schedule and query costs. We explain that jump in what a data warehouse is and when you need one.
4. Sources outside the Google ecosystem
Meta Ads, TikTok Ads, HubSpot, ERPs: none of them has a free native Google connector. Each one becomes a partner connector with its own monthly fee, usually per account or per source. For an agency with 15 clients, that total can easily exceed the price of a paid BI license, and almost nobody budgets for it in month one.
5. The dashboard shows, but does not explain
This is the least technical limit and the most expensive one. The dashboard shows that CPA went up 30% this week. It does not say whether it was creative fatigue, a pricier auction, broken tracking or a lower landing page conversion rate. The answer comes from a person opening three tabs and cross-checking numbers by hand.
Google knows this. Since July 2026, conversational analytics is generally available in the product, but data agents are not created inside Data Studio: they are built in BigQuery and shared to the report. In other words, it assumes your data already lives there. The gap between showing and explaining is the topic of dashboards vs reports: what is the difference.
Is Looker Studio the same as Power BI?
No. Both draw charts, but they start from different places. Looker Studio is lightweight and native to Google's ecosystem; Power BI has a real data model and charges for it in learning curve.
| Criterion | Looker Studio (free) | Data Studio Pro | Power BI |
|---|---|---|---|
| Entry cost | Free | US$9 per user, per project, per month | Free desktop, per-user license to publish |
| Google sources | Native and free | Same | Possible, with more setup |
| Non-Google sources | Paid partner connector | Same | Many native connectors |
| Modeling | Blends of up to 5 sources | Same | Relational model with DAX |
| Governance | Report belongs to a person | Belongs to the organization | Workspaces and permissions |
| Best for | Small teams living in Google | Teams that need control | Microsoft shops with a dedicated analyst |
The full comparison, with other options for small and mid-sized companies, is in is Power BI worth it? Alternatives for SMBs.
When to stay on Looker Studio and when to move on
The right question is not "which tool is better" but "which step is the operation on". Each step solves the previous one's problem and creates a new one.
Stay on Looker Studio if:
- almost all your data comes from Google (GA4, Google Ads, Search Console, Sheets);
- each dashboard uses up to three sources and few people use it at the same time;
- the dashboard is for monitoring, not for investigating.
Move on or add a layer if:
- quota errors have become a Monday routine;
- you pay more in connectors than you would for a proper tool;
- the team spends hours each week reconciling campaign names across platforms;
- the questions that matter most start with "why".
Picture an online fashion store with Google Ads, Meta Ads, Shopify and a CRM. In year one, a Looker Studio dashboard with GA4 and Google Ads does the job. In year two come Meta through a paid connector, a cost spreadsheet and a blend that stalls every Monday. The owner now has the number but not the explanation. At that point, switching charting tools does not help: what is missing is a layer that brings sources together and answers questions.
Frequently asked questions
Is Looker Studio free?
Yes. Creating and viewing reports costs nothing. The Pro tier is US$9 per user, per project, per month, and partner connectors for non-Google sources are billed separately.
Is Looker Studio being discontinued?
No, it was renamed. In April 2026 Google renamed the product Data Studio and the paid tier Data Studio Pro. Existing reports, sources and links keep working with no action needed.
Why does my GA4 report in Looker Studio show a quota error?
Because every chart queries the GA4 API, which has hourly and concurrent request limits per property. Cut charts per page, use the Extract Data connector or move GA4 into BigQuery with the native export. To understand GA4's data structure, see how Google Analytics 4 works.
Is Looker Studio the same as Power BI?
No. Looker Studio is simpler and connects Google's ecosystem for free; Power BI has relational modeling and more native connectors, with a steeper learning curve. If you live on GA4 and Google Ads, Looker Studio is usually enough to start.
Can I connect Meta Ads to Looker Studio?
Yes, but not natively. You need a partner connector, usually paid per account, or you export the data to a spreadsheet and connect that sheet to the report.
The dashboard shows, the conversation explains
Looker Studio is still the best free first step for anyone living in Google's ecosystem, and nothing here is a reason to drop it. The mistake is asking it for what it never promised: joining sources that do not talk to each other and telling you why a number moved. For that second part, Sherlok connects Meta Ads, Google Ads, GA4, your CRM and spreadsheets and lets you ask questions in plain language, the way you would ask an analyst, and get the analysis back ready to use. The two work well together: one monitors, the other investigates.
Your AI agents already know what to do in your account.
Turn them on free, no credit card.
- No credit card
- Read-only access
- Revoke it any time