
Practical Guide to Analyzing Digital Marketing Data
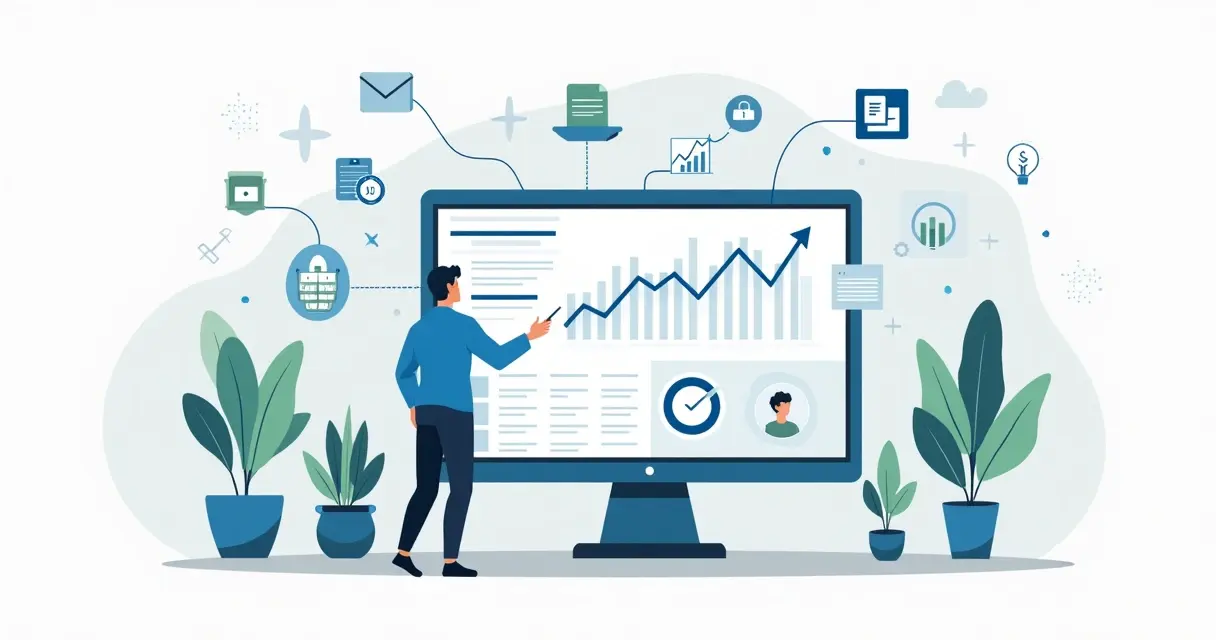
In the digital environment, everyone is seeking accurate decisions to multiply results and ensure growth. Transforming large volumes of information into tangible strategies is, in fact, the main challenge for marketing teams. The key to overcoming this barrier is to master the structured and intelligent use of data.
This guide presents a complete roadmap for applying marketing data analysis to today's reality, including examples, tips, metrics, and practical ways to create campaigns, attract customers, and identify opportunities. Throughout the text, it highlights how platforms like Sherlok boost this process by integrating and analyzing diverse information sources without technical effort, simplifying access to insights that drive businesses.
Understanding the concept: what is data analysis applied to digital marketing?
Before learning about methods and resources, it's worth understanding the central concept of this universe. The analysis process in marketing consists of collecting information from digital channels and transforming it into knowledge to guide decision-making. This includes observing engagement numbers on social media, paid campaign results, data from CRM, website traffic, lead behavior, among others.
The work is not limited to simply monitoring metrics. It involves selecting, combining, segmenting, and interpreting data according to the objectives and context of the actions, finding patterns and relationships that only emerge when everything is integrated.
From definition to action: stages of analysis in practice
Although each company has its own routine, most analysis processes follow similar flows that help organize tasks and facilitate execution. See how each stage contributes to generating value:
1. Definition of objectives and hypotheses
Every action begins with a well-formulated question. What do you aim to achieve with marketing data analysis? Do you want to increase conversions on a landing page? Improve engagement on a particular social network? Reduce the customer acquisition cost (CAC)?
These questions define what will be measured and which sources need to be integrated.
2. Collection of structured and integrated data
This is the moment to gather information. Here, many companies face obstacles, as not all platforms "talk" to each other. Uniting spreadsheets, ad data, CRM reports, chat or email conversation records, SEO data, among others, is a task that demands time and, at times, technical knowledge.
Tools like Sherlok simplify this integration by allowing the connection of various sources, including through artificial intelligence, promoting consistency and speed in the process.
3. Organization, cleaning, and segmentation
After gathering the data, it needs to be processed. This includes removing duplicates, adjusting field patterns, normalizing values (such as dates or currencies), and segmenting information by channel, source, or sales funnel stage.
Segmentation allows going beyond raw numbers, paving the way for deeper analyses, such as comparing performance by audience, region, device, or even display time.
4. Interpretation: how to transform data into insights
With everything clean and segmented, it's time to analyze trends, identify behavioral patterns, and cross-reference results that were previously scattered. Discovering the right insights allows for practical recommendations, such as budget adjustments, creative changes, communication personalization, identification of funnels, or promising new audiences.
5. Monitoring and evolution
Nothing is static. Analysis is only valuable if it is continuous, with monitoring of actions taken and adjustments based on new data generated. Automated alert solutions, like Sherlok, help by providing real-time information on deviations, opportunities, or unusual changes detected in integrated dashboards.
Tools and technologies: integration, automation, and artificial intelligence
The real leap in productivity happens when you go beyond traditional spreadsheets, adding technological tools that connect different areas and automate repetitive tasks. See examples:
CRMs: centralize contact history, funnel, and interactions
Analytics platforms: track access, conversion, and navigation data on websites
Marketing automation solutions: launch campaigns, collect leads, and analyze open/click rates
Data integrators: gather multiple sources into a single dashboard, allowing advanced comparisons and cross-referencing
AI-based tools: transform data into automatic reports, indicate trends, and create personalized recommendations
According to experts in content on data analysis with artificial intelligence, the ability to generate predictive and prescriptive insights grows exponentially with the adoption of artificial intelligence. These solutions can detect consumer behavior patterns that would go unnoticed manually, even by experienced teams.
In the business context, Sherlok plays this role by connecting everything in a simple environment, where any professional can navigate consolidated information, without reliance on technical teams and with automatic results always at hand.
Metrics, KPIs, and the most useful indicators
Numbers alone have little value without a clear context. Therefore, choosing and prioritizing the right metrics makes all the difference. See the most relevant digital marketing indicators for analysis:
Conversion rate: shows the percentage of visitors who perform the desired action, such as filling out a form or completing a purchase.
Cost per acquisition (CPA): indicates the average cost to acquire a customer or lead.
Return on investment (ROI): measures the profit generated by a campaign relative to the amount invested.
Engagement rate: sums reactions, comments, shares, and clicks on social media or emails.
Lifetime Value (LTV): indicates the average value generated per customer over the course of the relationship with the company.
Traffic by channel: discriminates accesses from searches, social media, email, or direct traffic.
Bounce rate: indicates the percentage of visitors who leave a page immediately after accessing it.
Average navigation time: shows how much time, on average, the audience spends on specific digital content.
Other indices can be included according to the business objective and the funnel stage the customer is in. To learn more about different solutions and their roles in company dashboards, the article "best data analysis tools for businesses" delves deeper into this topic.
“Metrics drive decisions that, when based on concrete data, change business stories.”
Segmentation and personalization: data in favor of strategies
Personalizing campaigns means delivering the right content, to the right person, at the right time. Analysis methods are indispensable for identifying trends, behaviors, and preferences of different customer groups. See situations where segmentation makes all the difference:
Dividing the audience by region or city to personalize local offers
Analyzing interests of different segments, adapting the type of content sent by email
Creating remarketing campaigns for users who have already interacted without converting
Differentiating communication between hot and cold leads in the funnel
Detecting more relevant channels for each group, e.g., young people preferring Instagram and TikTok, professionals resorting to LinkedIn or email
These examples prove that the more precise the analyses and segmentations, the higher the conversion and customer retention rates achieved.
How Sherlok transforms data into concrete opportunities
Many companies encounter operational limitations due to reliance on manual spreadsheets, complex integrations, or scarce technical teams. Sherlok was developed to eliminate these barriers by integrating and processing data from various sources automatically, without requiring programming or BI knowledge.
Connects advertising, SEO, CRMs, marketing platforms, and databases in one place
Offers intuitive visual dashboards, making it easy for leaders and analysts to see what really matters
Generates automatic reports and insights in simple language
Sends alerts about trends, deviations, or new opportunities automatically detected by artificial intelligence
Allows quick configurations and expansion as the business grows
With this, marketing professionals and managers can focus on strategic decision-making, rather than repetitive manual operations or technical integration problems.
The role of predictive and prescriptive analytics
Evolving to a new level, predictive analytics (predicting what should happen) and prescriptive analytics (indicating which decisions to make based on mapped scenarios) emerge. Modern tools, like Sherlok, allow small and medium-sized businesses to access resources that, until a few years ago, were restricted to large corporations.
Predictive analytics: uses historical data to identify patterns and predict future behaviors, such as sales seasonality, changes in click-through rates, or even customer churn.
Prescriptive analytics: in addition to predicting, it suggests recommendations and actions. For example, if a drop in engagement for a specific ad is identified, it can suggest changing the image, sending time, or an alternative offer.
By bringing this type of intelligence closer to the teams, decision-making becomes more agile, proactive, and less subject to guesswork, resulting in greater competitiveness.
Common mistakes and best practices in data analysis applied to digital marketing
Despite advances, many professionals still make mistakes that hurt the potential of their data. Learn about some frequent pitfalls and how to avoid them:
Focusing on vanity metrics, such as followers or views, without assessing the impact on sales or lead generation.
Working with outdated or poorly segmented databases, compromising the accuracy of analyses.
Disregarding experiments and A/B tests to validate hypotheses with real audience samples.
Ignoring integration between channels, keeping information isolated, which hinders a global view of campaigns.
Not following up on previous insights, failing to continuously refine strategies.
To minimize these risks:
Establish clear objectives and review them periodically
Prioritize data cleaning before segmenting or comparing
Monitor indicators that genuinely affect the business
Invest in solutions that automate data collection, integration, and reporting
Seek continuous training for the team, valuing ongoing data-driven learning
Practical examples: how insights change strategies
Practice shows how well-executed analyses lead to more accurate decisions and, consequently, more profitable campaigns. See some real-world examples of how this impacts results:
By realizing that customers in a certain region buy more at specific times, adjusting email sending resulted in an 18% increase in conversions.
Analyzing behavior on landing pages, a company identified that 70% of users abandoned the form at the second step. By simplifying the fields, the completion rate increased from 7% to 21%.
Monitoring comments on social media, a recurring customer query was quickly identified, leading to the creation of an automatic FAQ that reduced support requests by 25%.
Integrating sales information with interaction history in the CRM made it possible to identify which content impacted each customer profile across different channels.
“The right information, at the right time, can become a definitive advantage over the competition.”
On the Sherlok blog, there are several articles on data analysis with examples that show the real impact of these practices in daily business.
Main trends and the future of data analysis in marketing
Constant changes in technology, privacy, and consumer behavior force companies to evolve. The current scenario points to a series of trends that transform the area:
Adoption of artificial intelligence to automate both data collection and interpretation
Use of intuitive dashboards based on advanced data visualization, enabling fast decisions
Greater integration between sectors (marketing, sales, customer service) to view the customer journey as a whole
Growing focus on personalization of all stages, from initial segmentation to after-sales actions
Concern for privacy, requiring clear user consent and transparency in all information processing
Predictive analytics not just as an option, but as a standard to anticipate trends and adapt strategies quickly
Solutions like Sherlok already deliver automation and integration features that, until recently, were restricted to highly specialized professionals, democratizing access to business intelligence.
How to stay updated and apply it daily
With so many new developments, keeping up with trends makes a difference in strategy performance. Constant learning, exchange with other professionals, and the search for specialized content, such as the integrated business intelligence guide, strengthen the culture of data-driven decisions.
It is also recommended to seek updated references and content. Check out the article on digital marketing data analysis to broaden your understanding of the topic.
Conclusion
Intelligent analysis of digital marketing data has ceased to be a differentiator and has become a fundamental practice in modern businesses, regardless of company size.
Flexible and intuitive solutions, such as Sherlok, democratize this access by enabling integration, automation, and dynamic reports, raising the performance level of teams and bringing the necessary security for more precise decisions.
Deepening the use of data is the next step to transform numbers into real opportunities, retain audiences, and exceed growth targets. Therefore, be part of the innovation and discover how Sherlok can boost your results by connecting data and teams simply.
Frequently asked questions about digital marketing data analysis
What is marketing data analysis?
Marketing data analysis consists of collecting, processing, and interpreting information generated by digital campaigns, customer interactions, website traffic, and sales data to support strategic and operational decisions. With it, it is possible to better understand audience behavior, identify opportunities, and correct bottlenecks in operations, boosting results.
How to start analyzing marketing data?
The first step is to define clear objectives, such as improving conversions or identifying new audiences. Then, it is recommended to choose the collection platforms (social media, website, CRM) and seek solutions that integrate information practically, such as the Sherlok platform. From there, simply structure the data, segment it according to goals, and monitor it to continuously adjust strategies.
What tools facilitate data analysis?
Tools like analytics platforms, CRMs, and data integrators enable easy cross-referencing and visualization of information. Software with artificial intelligence, like Sherlok, also automates reports, integration, and alerts, making the process more practical and faster even for those without a specialized technical team.
Why analyze data in digital campaigns?
Analyzing data allows for a precise understanding of the performance of each action, audience segment, or media channel, avoiding waste with inefficient investments. Furthermore, detecting real-time trends and responding quickly to market changes increases competitiveness and the strength of campaigns.
Which metrics are most important in marketing?
It depends on the strategy's objective, but some fundamental metrics are: conversion rate, cost per acquisition, return on investment (ROI), engagement, lifetime value (LTV), bounce rate, and traffic by channel. Monitoring should be adapted according to funnel stages, audience, and campaign type, allowing adjustments to achieve better results.
Corporate decision roadmap guided by data intelligence
Globe formed by colorful numbers surrounded by technology icons generating data
Digital marketing dashboard with graphs and data integration icons
Your AI agents already know what to do in your account.
Turn them on free, no credit card.
- No credit card
- Read-only access
- Revoke it any time