
Data: A Practical Guide for Smart Business Decisions

Making good business decisions has always required attention and strategy, but today the secret lies in data. Numbers, information, reports, and indicators are more than technological trends: they have become key pieces to guide leaders and teams in any area. The ability to connect, interpret, and act based on these digital assets sets the pace of innovation.
Smart decisions are born from understood data.
What is data and why is it relevant to businesses?
Data are structured or unstructured representations of facts, events, transactions, or behaviors that, when analyzed, become knowledge for businesses. They range from financial records, customer lists, campaign results to email texts and meeting impressions. In essence, they allow managers to answer fundamental questions: what is happening, why it happened, what can change, and how to act.
According to CAPES, data governance involves aligning strategy, processes, people, and technology, showing that well-managed information is the backdrop for lasting advances, not only in the public sector but also in private organizations.
If there are still doubts about the impact, just look at the projections from FGV Confiança, which uses business confidence indices to anticipate economic trends, all based on the intelligent collection and interpretation of real-time information.
Difference between structured and unstructured data
In practice, information reaches companies in different forms. Understanding these variations is essential to enhance analysis and avoid decision errors.
- Structured: organized in rows and columns (spreadsheets, databases, financial reports). They have a standardized format, facilitating automatic searches, filters, and cross-referencing.
- Unstructured: include email texts, audio, videos, images, notes, social media messages. They are more free-form, requiring advanced processes for meaning extraction, such as those offered by artificial intelligence.
A sales manager can compare total revenue for the semester (structured information) with customer sentiment on social media (unstructured content), cross-referencing both to plan more assertive launches.
In daily corporate life, these two natures coexist. Platforms like Sherlok connect different types of information, simplifying the integration between tables, documents, and even consumer opinions posted online.
How data management drives predictive analytics
Careful management of information's lifecycle, from collection to disposal, makes all the difference when working with predictability. Efficient management implies documented processes, standardization, treatment, and constant updating of records.
Predictive analytics, for example, relies on a solid history. By mapping sales, website traffic, customer service calls, and even supply chain disruptions, specialists can anticipate market movements.
- Retail: predict seasonality or product highs/lows;
- Industry: anticipate machine failures and adjust maintenance;
- Healthcare: understand service and risk patterns;
- Financial services: calculate the probability of default.
With the right technology, managers don't need to be mathematicians. Solutions like Sherlok automate information collection, ensuring that reports feed predictions fluidly and continuously for all business sectors.
Prediction is only possible with a secure foundation.
Integration and automation: bringing everything together in one place
In the real world, each department adopts its own systems. CRM, marketing platforms, Excel spreadsheets, and database APIs coexist side-by-side, not always in an organized manner. The big challenge is to unify all this diversity without generating rework or depending on programming skills.
- Digital campaigns generating leads on advertising platforms;
- Sales recorded in CRMs or ERPs;
- Customer service via chat and social media;
- Financial indicators in databases or spreadsheets.
In the past, connecting these dots demanded lengthy IT projects. Today, intelligent platforms like Sherlok make it possible to integrate everything simply, visually, and automatically.
According to business intelligence specialists, the secret is to take advantage of native integrations with different sources, centralizing dashboards without the user needing to understand code. Well-designed tools offer connectors for marketing, sales, logistics, or human resources, translating numbers into clear insights for everyone.
To delve deeper into this universe, check out the guide business intelligence: a simple guide to integrating and analyzing data and also the data analysis category on Sherlok's blog.

Positive results emerge when teams have quick and visual access to the most relevant indicators. According to manager reports, automation reduces time spent on manual searches and duplicated spreadsheets.
Security, privacy, and quality: risks and best practices
The advancement of technologies has brought gains, but has also raised an alarm for risks involving information protection and integrity.
- Accidental exposure of sensitive records;
- Inadequate access by unauthorized persons;
- Data loss due to misconfiguration;
- Duplicated or outdated information causing errors in reports.
According to CAPES guidelines on governance, the lifecycle of corporate records must include security policies, explicit consent from data subjects, constant quality validation, secure deletion, and periodic updating.
Reliable data needs well-defined rules.
In practice, Sherlok employs rigorous standards to ensure that only authorized users access sensitive environments, in addition to real-time monitoring and incident notifications.
Among the best market routines, highlights include:
- Implementation of multiple permission levels;
- Continuous team training;
- Automatic backup and file encryption;
- Periodic process review and audits.
This tripod, protection, privacy, integrity, allows companies to trust what is being analyzed and planned, without running unnecessary risks.
Artificial intelligence as an ally in analysis and recommendations
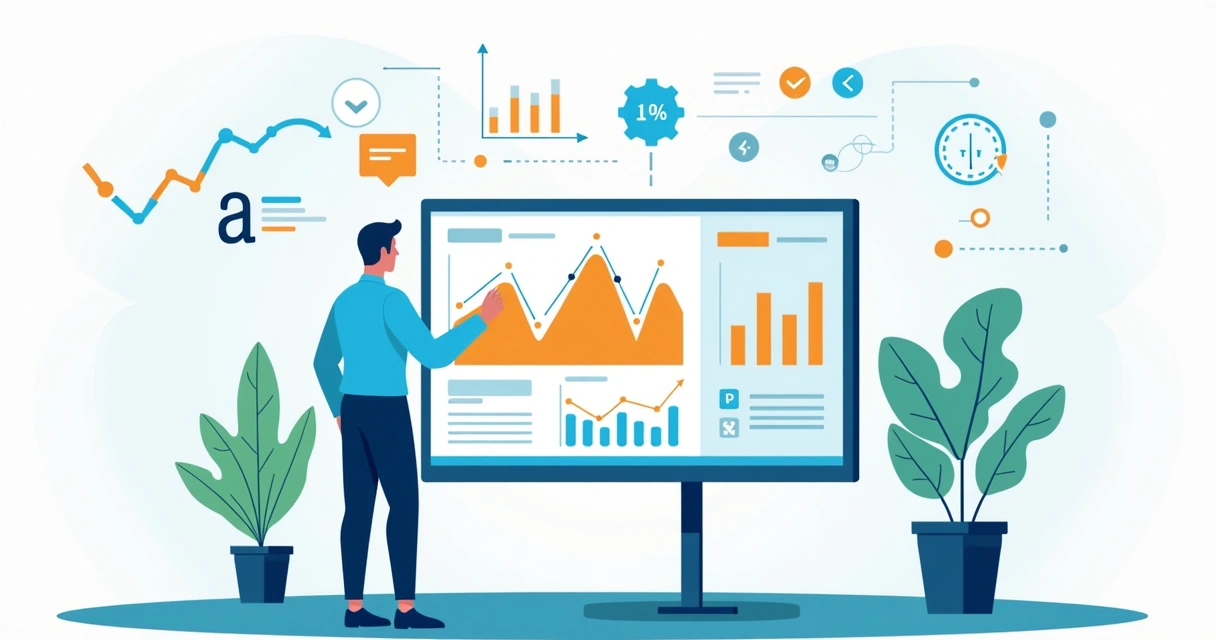
Once a company collects and organizes data, the desire arises to find patterns, trends, and opportunities that human eyes do not easily perceive. It is in this scenario that artificial intelligence gains prominence, transforming the role of analysts and managers.
AI applies advanced techniques to identify anomalies, predict market movements, segment customers, and even suggest actions, all in real time.
Platforms like Sherlok already allow professionals to receive automatic alerts, predictive reports, and even concrete recommendations to increase results.
-
Marketing: AI identifies hidden patterns in consumer behavior, automatically segments campaigns, and points out reputation crises before they escalate.
-
Finance: tracks suspicious transactions and suggests automatic adjustments to reduce credit risks.
-
Industry: monitors equipment sensors and anticipates failures, reducing maintenance costs.
-
Human Resources: points out turnover trends and recommends retention measures.
To learn more about how algorithms and automation empower businesses, read the article on data analysis with AI for business decisions.
AI transforms simple records into strategic moves.
Tools that combine automation with intelligence already generate a competitive advantage, especially for organizations seeking to gain agility and reduce the number of errors in high-impact choices.
Practical examples: data application in different sectors
The transformation journey only makes sense when it impacts daily life and generates real value. See how some segments use structured and unstructured information to underpin better decisions:
-
E-commerce: By cross-referencing each customer's sales history with browsing behavior, it is possible to personalize product recommendations and increase average ticket, as well as predict peaks to adjust inventory.
-
Industry: using data from machine sensors and maintenance records, factories program preventive interventions, avoiding unexpected shutdowns.
-
Healthcare: Clinics analyze medical records and text mining of patient files to suggest better treatments. Predictive monitoring assists in the care of chronic patients.
-
Financial services: Interpretation of transactions and cross-referencing with market trends identify investment opportunities and risks.
-
Education: Attendance, performance, and social media participation reports generate personalized teaching plans.
All these sectors are already seeing gains in competitiveness by investing in modern platforms with integration, automation, and artificial intelligence, a result confirmed in studies such as FGV Confiança, a national reference in analyzing market sentiment through indicators.
Want to know how to choose the best solution for your team? See the article on data analysis tools recommended for businesses.
Building a culture where decisions are data-driven
Adopting new tools is just the beginning. The big leap happens when employees understand the value of information and use these assets daily to discuss, propose projects, and measure results.
A data-driven culture encourages evidence-based questions. It allows managers to challenge assumptions and make more assertive decisions, minimizing guesswork and wasted resources.
- Leaders should encourage the intelligent use of information;
- Training and workshops accelerate learning;
- Shared results demonstrate the value of the process;
- Openness to error and continuous improvement are essential;
- Clear indicators and collaborative dashboards bring teams closer.
Companies that achieve this change become more ready to innovate, adapt, and grow, even in uncertain scenarios.
If the goal is to know how to unite technology and strategy, see also the content on big data to integrate, analyze, and make better decisions.
Conclusion
Increasingly, the difference between market leaders and struggling companies lies in the quality of the information that drives their decisions. Whether in retail, industry, services, or the public sector, investing in integration, automation, and artificial intelligence is the surest way to achieve predictability and expressive results.
If you're looking to transform your relationship with strategic information and want to experience the evolution of data in your routine, explore Sherlok's solutions. Discover how the platform can personalize analyses, generate automatic recommendations, and simplify the connection between different systems. It's time to make informed decisions and grow with confidence.
Frequently asked questions about corporate data
What is data in businesses?
In businesses, data represents captured records and information about customers, processes, purchases, sales, interactions, performance, and operations. They serve as the basis for building knowledge and underpin almost all important decisions, from launching a new product to defining marketing campaigns and investment strategies.
How to use data to make decisions?
To make data-based decisions, an organization needs to collect information from reliable sources, integrate these records centrally, and use algorithms or statistical analyses to identify patterns and trends. From this analysis, leaders interpret the results and choose the safest paths, avoiding decisions based solely on assumptions or guesswork. Modern platforms, such as Sherlok, present automatic dashboards, key indicators, and recommendations, speeding up the process.
What are the main types of corporate data?
The most common types in businesses are divided between structured (databases, spreadsheets, financial records) and unstructured (emails, photos, audio, social media texts). The former are standardized and organized in tabular formats, while the latter require specific tools, such as AI, for interpretation. Both are indispensable for modern decision-making.
Is it worth investing in data analysis?
Companies that invest in data analysis gain agility, reduce errors, and achieve a competitive advantage. The investment in infrastructure, integrated platforms, and training quickly pays off when indicators are monitored in real-time, facilitating the identification of opportunities and risks before the competition.
How can data analysis help my business?
Data analysis allows you to predict demands, personalize offers, optimize resources, anticipate problems, and improve customer relationships. Intelligence tools, such as those from Sherlok, also automate much of this work, delivering alerts, reports, and recommended actions to boost results. Computerized companies, which rely on a data-driven culture, show greater adaptation and success in challenging scenarios.
Your AI agents already know what to do in your account.
Turn them on free, no credit card.
- No credit card
- Read-only access
- Revoke it any time