
Local business data: the basics almost nobody tracks
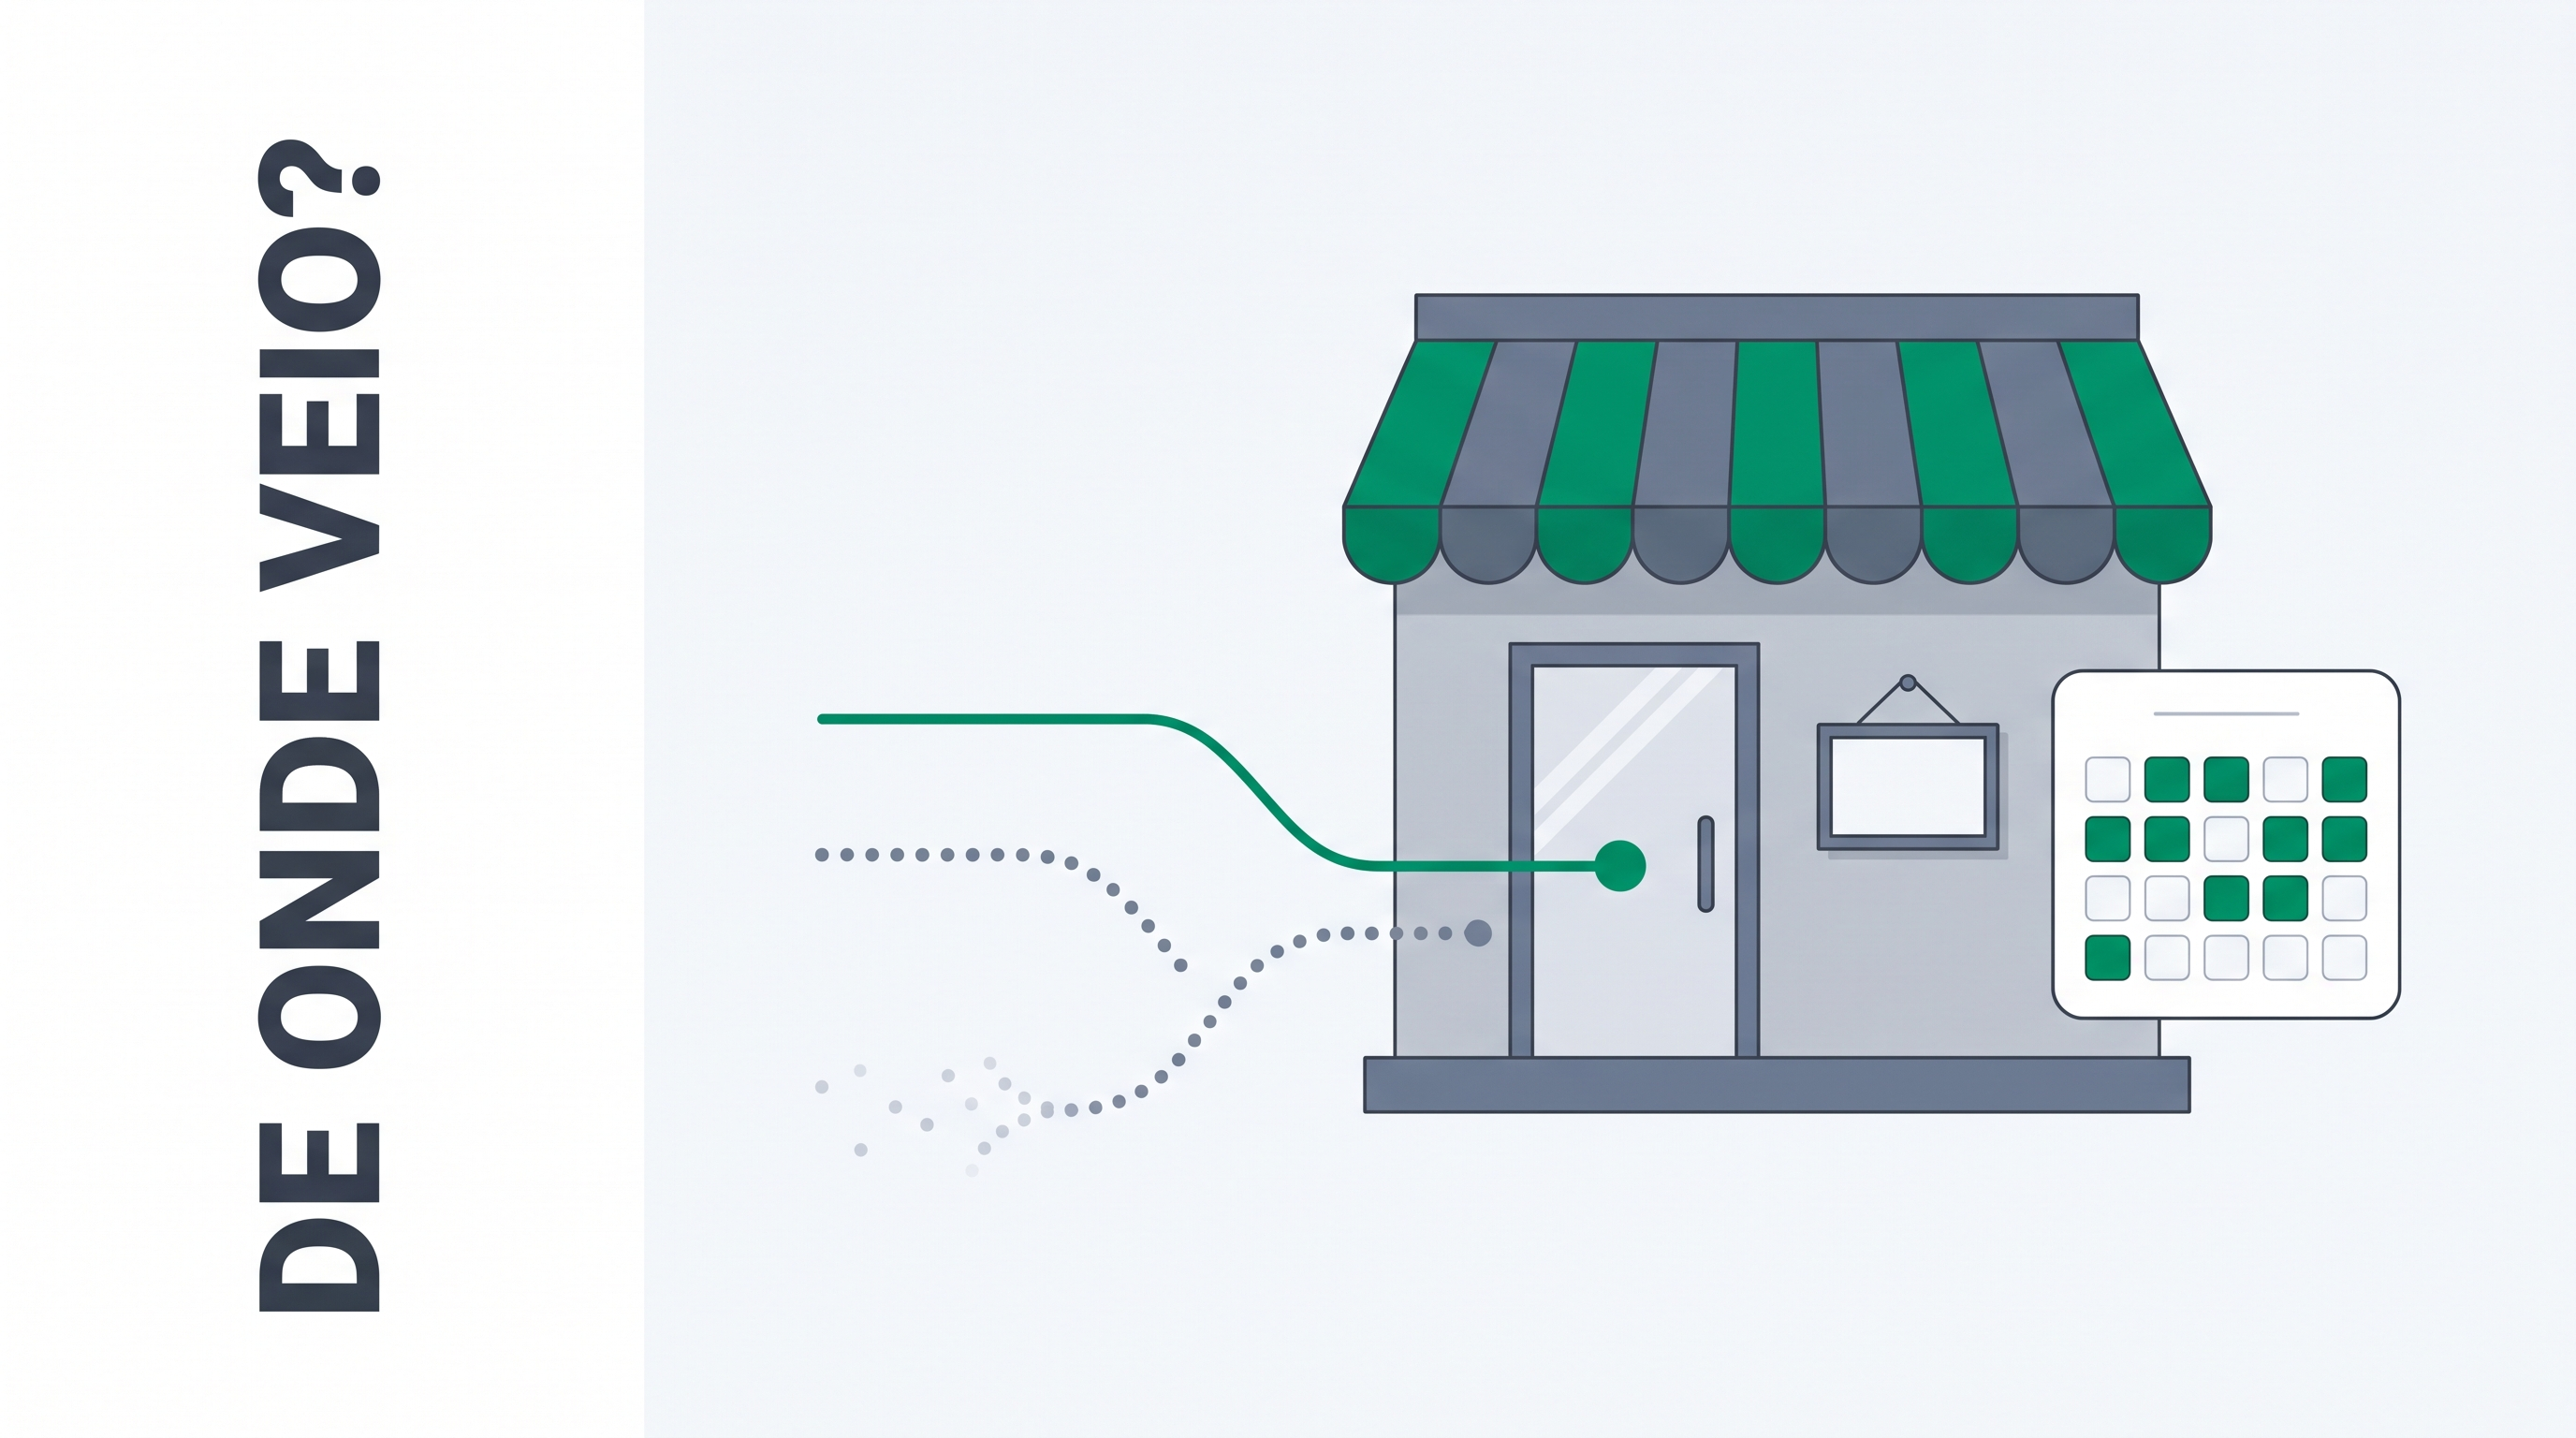
A neighborhood physiotherapy clinic has three sources of information about its own business: the scheduling app at the front desk, the bank statement, and the ad account someone in the family manages on Tuesdays. All three exist. None of them talks to the others, and nobody ever puts all three on the same table.
The owner knows September beat August. He does not know why. It could have been the new ad, the partnership with the gym next door, or simply the fact that September had more working days. So he keeps everything: the ad, the partnership, and the first-session discount. He pays for three things when, most likely, only one is working.
This is not a technology problem. It is the absence of three records that take ten minutes a day.
Working with local business data means logging four things: where each new customer came from, how much of the schedule was actually filled, how much revenue each service produces, and what it cost to bring a customer in. Four numbers, refreshed weekly. With them you decide where to invest; without them, you guess.
Why a local business is the easiest case (and the most neglected)
A 200-store retail chain needs data engineering to know what is going on. A clinic with two treatment rooms, a salon with four chairs, or a repair shop with three bays needs a spreadsheet and discipline. The volume is small, the variables are few, and the decision cycle is short: you change something on Monday and see it in next week's schedule.
Neglect is still the norm. Sebrae's Financial Habits of Small Businesses survey, released in January 2026, found that 61% of Brazilian entrepreneurs pay company expenses from a personal account. On tracking money, 30% use a spreadsheet, 25% write in a notebook, 20% use an app, and 10% track nothing at all. When the business account and the household account are the same account, no profitability number is trustworthy, because the source data is already contaminated.
On the acquisition side, the picture is just as awkward. Doctoralia's Panorama of Clinics and Hospitals 2026, published in April 2026 with more than 600 managers surveyed, found that 75% of clinics buy paid media while 67% have never mapped the patient journey. Three in four pay to be found; two in three have no idea how they were found.
The figures are Brazilian, but the pattern travels. It means a marketing budget set by gut feeling, and gut feeling has a known bias: you remember the one customer who praised the ad and forget the ten who came by referral.
What data should a local business track?
Four things. Not twenty. Twenty indicators in an eight-person business become a report nobody reads.
1. Where the new customer came from
This is the most valuable number and the easiest one to lose. It only exists if someone asks and writes it down at first contact, because customers forget afterward. The categories can stay crude: referral, Google, Instagram, walked past, insurance, or partnership covers 95% of cases in a local business.
One refinement changes the outcome: split "referral" into "referred by whom." If three new customers this month came from the same person, you do not have a channel. You have an informal business partner who might deserve a formal commission.
2. Schedule utilization
Revenue hides idle capacity. Two months can close with identical revenue, one at 80% utilization with a lower average price, the other at 55% with a higher one. Those are opposite situations that call for opposite decisions. Utilization is appointments delivered divided by appointments available, measured weekly and, ideally, by staff member and by time of day. That is where the pattern every local business has, and few can see, shows up: the dead Tuesday morning and the packed Friday afternoon.
3. Revenue by service, not by customer
Service businesses almost always have one offering that sells a lot and pays little. It fills the calendar, creates a sense of momentum, and carries the cash register only briefly. Breaking revenue down by service type, instead of watching the overall average ticket, is what reveals where the margin actually sits. If you know the hourly cost of the person delivering it, better still: you can compare what each service earns per occupied hour.
4. Cost per new customer
Add up everything spent to bring people in (ads, flyers, sponsoring the local team, referral commissions, opening-day giveaways) and divide by the number of new customers in the period. It is the local version of CAC. The number only means something when you compare it against what a customer leaves over the whole relationship, not against the first purchase. A $30 haircut that becomes 10 visits a year is a $300 customer.
How to find out where your customers come from with no tooling at all
This is where most owners give up, assuming sophisticated tracking is required. In a local business, the question at the front desk still beats the technology, as long as it is asked every time. The options, with each one's flaw:
| Method | Effort | Where it breaks |
|---|---|---|
| Ask at first contact and log it in the customer record | Low, daily | Depends on whoever answers; collapses on busy days |
| A separate phone number or link per channel | Low, one-off | Only captures people who call, not walk-ins |
| A unique coupon or code per campaign | Medium | Attracts discount hunters and distorts the ticket |
| Digital attribution with UTMs and GA4 | Medium, technical | Ignores referrals and foot traffic, which are half the game |
The arrangement that almost always works is the first combined with the second, plus one operating rule: the customer record cannot be saved without the source field filled in. It feels bureaucratic. It is also the difference between having the data in three months and staying in the dark.
What does an empty slot cost?
Idle capacity is the loss that never shows up anywhere. It is not an expense, it generates no invoice, it never hits the bank statement. It just shrinks the result. The math below is my own simulation, with deliberately round numbers, to show the order of magnitude in a small operation.
A clinic with one treatment room, four appointments a day and five working days has 20 slots a week. If 11 are delivered, utilization is 55%. At a $90 ticket, the nine empty slots equal $810 of revenue left on the table per week, roughly $3,200 a month.
Here is the part that changes the decision: if that clinic spends $600 a month on ads, the owner is looking at the wrong line. Arguing about cutting $150 of ad spend is small next to $3,200 of empty calendar. Low utilization is rarely fixed with more traffic. It is usually fixed with active confirmation the day before, a waitlist for last-minute fills, and dead hours offered at a different price.
Before you accept that reasoning, an honest trade-off: pushing utilization at any cost is a trap. Fill the dead Tuesday morning with your lowest-margin service and the calendar looks great while the result does not move. Utilization has to be read alongside revenue by service, never on its own.
The mistake of watching monthly revenue alone
Revenue is an aggregate, and aggregates hide trends almost by definition. A salon can bill the same amount two months in a row after losing half its color clients (high margin) and doubling its blow-dry volume (low margin). On the monthly dashboard, nothing happened. Structurally, quite a lot did.
So the tracking has to be weekly and by composition, not by monthly total. Three questions answered every Monday give more control than any quarterly report: how many new customers came in and through which door, what utilization was, and which service grew while another shrank. If you want to go past the operational layer, the basic financial indicators complete the picture.
How to set this up in one week
- Monday: separate the business account from the personal one. Without that, no profitability number holds.
- Tuesday: add the source field to the customer record and agree with the team on the exact wording of the question. One sentence, the same for everyone.
- Wednesday: build a spreadsheet with four weekly columns (new customers, source, appointments delivered over available, revenue by service).
- Thursday: total up last month's real acquisition spend, including the parts you do not call marketing.
- Friday: block 20 minutes every Monday to look at the four numbers. The ritual matters more than the tool.
Four weeks in, you have a baseline. Three months in, you have seasonality. It is fast precisely because the business is small, and that is the one data advantage a local business holds over a large chain: the learning loop is short.
Frequently asked questions
Which data should a local business track first?
New-customer source and schedule utilization. Those two answer the questions that cost the most money: where to invest to bring people in, and how much capacity is being wasted. Revenue by service and cost per new customer come in month two, once there is history to compare against.
How do you calculate a no-show rate?
Divide the number of appointments where the customer did not show up by the total appointments in the period, then multiply by 100. If 18 of 120 booked slots became no-shows, the rate is 15%. Measure it weekly and by time of day, because no-shows are almost never evenly spread.
What no-show rate is acceptable?
There is no universal figure; it swings widely by sector, region and service type. The useful benchmark is your own history: set the last three months' average as the baseline and work below it. Be skeptical of market figures quoted with no source and no year attached.
Do I need management software, or will a spreadsheet do?
A spreadsheet works while logging is manual and volume is low. It stops working when three people edit the same file, when you need to cross the calendar against payments received, or when consolidating starts taking longer than deciding. That is the moment to connect the sources, not to buy the most expensive system on the market.
Can I compare my numbers to industry averages?
Carefully. Sector averages blend very different realities (neighborhood, price point, size) and serve better as an order of magnitude than as a target. Comparing you against you, week over week, produces better decisions than chasing a benchmark of dubious origin.
Four numbers and one Monday
The gap between a local business deciding in the dark and one deciding with information is not budget. It is routine. Four numbers, refreshed weekly, settle most of the arguments that currently consume meetings and money. Everything else is refinement.
Once those records exist, the bottleneck moves: it leaves collection and lands on interpretation. That is when it makes sense to connect the calendar, the payments and the ad accounts in one place and simply ask, in plain language, "where did my new customers come from in the last four weeks, and what did each channel cost." That is what Sherlok is for: you ask, it returns the finished analysis from your connected sources.
Sources: Sebrae, Financial Habits of Small Businesses survey (2026); Doctoralia, Panorama of Clinics and Hospitals 2026.
Your AI agents already know what to do in your account.
Turn them on free, no credit card.
- No credit card
- Read-only access
- Revoke it any time