Sales Funnel: How to Build and Measure Every Stage
In RD Station's Panoramas 2026 survey, 75% of Brazilian companies admitted they missed their sales targets in 2025. The number almost nobody talks about sits right next to it: 62% don't track the conversion rates of their own funnel. Three out of four companies missed the mark, and most of them can't say at which point of the journey they lost the customer.
It's not a lack of effort. It's a lack of instruments. A well-built sales funnel is exactly that: the panel that shows where money leaks between first contact and signed contract. And building one doesn't require expensive software or a six-month consulting project. It requires clear criteria, discipline, and about four division problems.
How to build a sales funnel: define the stages your customer moves through (visitor, lead, opportunity, proposal, and sale), set an objective rule for advancing from one stage to the next, record everything in a CRM or spreadsheet, and calculate each stage's conversion rate every month. The bottleneck is the stage whose conversion drops the most against its own history.
What is a sales funnel in practice?
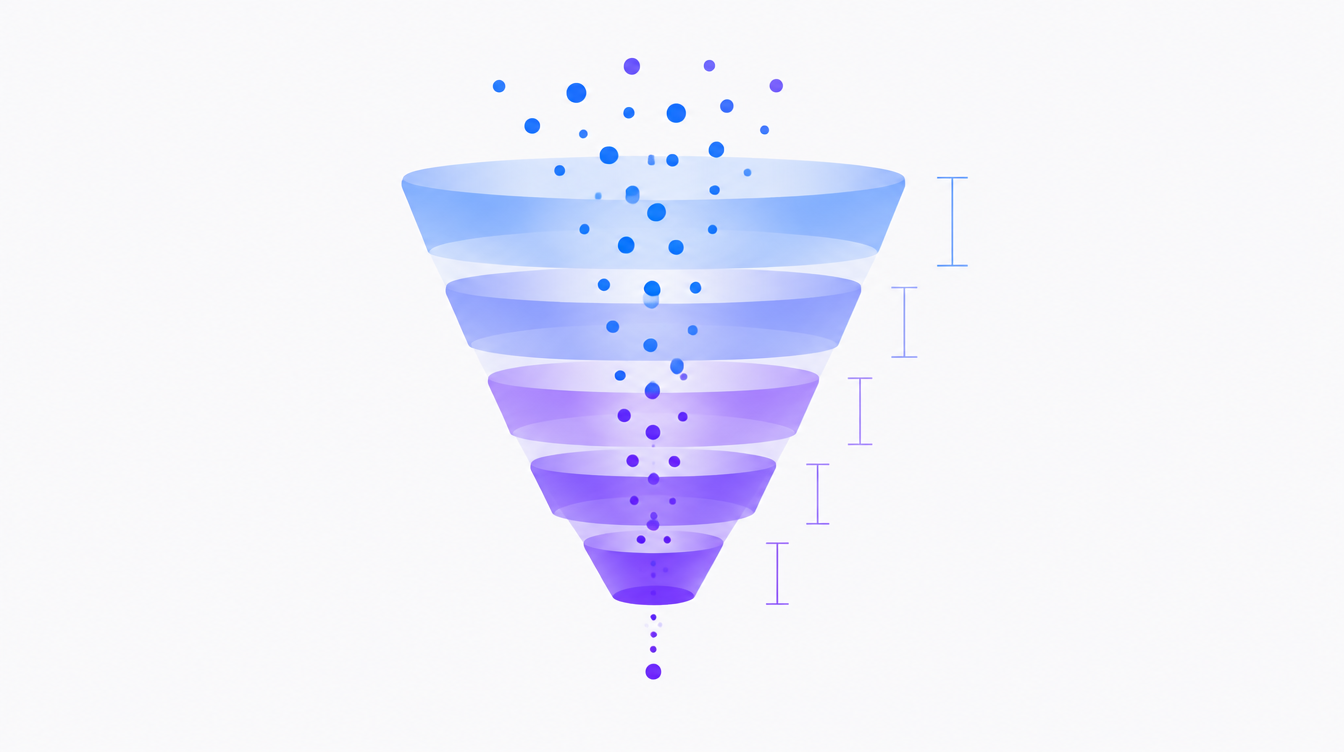
A sales funnel is the model that splits the buying journey into measurable stages, from first touch to close. The name comes from the shape: many people enter at the top, few come out at the bottom. So far, any agency slide deck can explain that.
What separates a real funnel from a pretty diagram is one thing: stage-passing criteria. If your team can't state, with an objective rule, when a lead becomes an opportunity, the funnel measures nothing: each rep classifies deals however they like, and your conversion rate becomes an opinion. In practice, that's why most funnels fail. Not for lack of stages, but for lack of a definition of what moves a contact forward.
Another common confusion: the sales funnel is not the marketing funnel. Marketing owns the journey from attraction to qualified lead; sales starts there and goes to the contract. The two connect, but they measure different responsibilities, and mixing them is the recipe for marketing and sales trading accusations at the results meeting. Only 16% of Brazilian companies report satisfactory integration between the two teams, according to the same RD Station study.
How to build a sales funnel in 5 steps
1. Map the real journey, not the ideal one
Take your last 20 sales and reconstruct each path: how the customer arrived, how many conversations happened, who decided, how long it took. The funnel should mirror how your customer actually buys, not how the playbook says they should. An e-commerce operation has a short funnel (visit, cart, checkout, purchase); a high-ticket B2B sale may have seven stages and a sixty-day cycle.
2. Define stages with objective passing criteria
Write a binary rule for each stage. For a typical B2B funnel: a lead is someone who left valid contact information; an opportunity is a lead with budget and need confirmed in a conversation; a proposal is an opportunity that received a commercial document; a sale is a signed contract. If a rule needs interpretation, it will be interpreted, each rep in their own way.
3. Choose where to record it (and record everything)
A CRM is the natural home, though in Brazil 54% of companies still operate without one. If a spreadsheet is where you can start, start there: an up-to-date spreadsheet funnel beats an abandoned CRM. What's essential is that every deal has its stage, value, source, and entry date recorded. Without dates you can't measure velocity; without sources you don't know which channel brings customers who actually close, which directly affects your CAC.
4. Calculate the conversion rate of each stage
The formula is simple: the number that advanced divided by the number that entered, times 100. What changes the game is calculating it per stage rather than only overall. Overall conversion hides the problem; per-stage conversion points to where it lives. We break down the math in the next section.
5. Review monthly, with the rates on the table
A funnel is not a project, it's a routine. A 40-minute monthly meeting reviewing per-stage rates against the previous three months solves more than any generic sales training. If you want to structure that ritual, see our guide on building a marketing report.
How do you calculate conversion rate per stage?
Stage conversion rate = (deals that advanced ÷ deals that entered the stage) × 100. Let's run the numbers from the funnel above, for a fictional equipment distributor in Campinas, Brazil, in a typical month:
| Stage | Volume | Stage conversion | Reading |
|---|---|---|---|
| Visitors → Leads | 10,000 → 400 | 4.0% | Healthy for paid + organic traffic |
| Leads → Opportunities | 400 → 120 | 30.0% | Qualification working |
| Opportunities → Proposals | 120 → 30 | 25.0% | Bottleneck: 90 opportunities die without a proposal |
| Proposals → Sales | 30 → 9 | 30.0% | Closing within expectations |
Overall conversion is 9 ÷ 10,000 = 0.09%. That number alone guides no decision. The per-stage reading, however, shows the problem is neither attracting nor closing: only one in four qualified opportunities ever receives a proposal. Every percentage point recovered there is worth more than doubling the media budget. If the team starts converting 50% of opportunities into proposals, sales jump from 9 to 18 without spending one extra dollar on ads.
On market benchmarks: use them sparingly. First Page Sage's data puts the average MQL-to-SQL conversion for B2B SaaS at 13%, ranging from 26% on channels like PPC to 51% on SEO. The same company, though, could accurately report 13% or 42% depending on how it defines an MQL. External benchmarks calibrate initial expectations; the ruler that decides is your own history.
How do you find the funnel's bottleneck?
The bottleneck is the stage where conversion sits farthest from your own historical pattern, not necessarily the stage with the lowest percentage. Comparing stages against each other is a classic mistake: visitor→lead will always convert less than proposal→sale, and that's normal.
The method that works: build the series of per-stage rates for the last 6 months and look for the drop. If proposal→sale used to run at 40% and fell to 25%, the bottleneck is there, even if that rate still looks "high" next to the others. Then investigate with three questions. Did the volume entering that stage change profile (different source, colder leads)? Did the process change (new pricing, new rep, slower response times)? Did the market change (aggressive competitor, seasonality)?
A common mini-case: a mid-sized dental clinic in Fortaleza, Brazil, saw sales drop 20% and the first reaction was to raise ad spend. Once the funnel was in place, they discovered the booking→show-up rate had fallen from 70% to 45%. The problem was the five-day gap between contact and appointment, not attraction. Cutting the wait to 48 hours recovered the result without an extra cent of media. Without the funnel, they would have paid more for the same leak.
A trade-off worth admitting: this logic breaks when volume is small. With 10 proposals a month, one extra sale moves the rate by 10 percentage points, a swing that is noise, not trend. In that case, analyze quarters instead of months, or track the currency value sitting in each stage instead of the percentage.
Where funnels break: 3 common mistakes
Too many stages. A nine-stage funnel becomes bureaucracy: reps stop updating it and the data rots. Four to six stages cover the vast majority of operations. If two stages always show the same conversion, they are one stage.
Measuring only volume, not velocity. Two operations with identical rates can produce very different results if one closes in 15 days and the other in 60. Record the entry date for each stage and track average time. A deal stuck for more than twice your average cycle rarely closes, and is a candidate to leave the pipeline.
Treating the funnel as a photo, not a film. Last month's rate describes the past. What drives action is the trend: three consecutive months of decline in one stage is a clear signal; a single isolated month almost never is. The right KPIs for each funnel stage help separate signal from noise, and a well-built sales dashboard keeps that trend visible without manual effort.
Frequently asked questions
What are the stages of a sales funnel?
The classic model has a top (attracting visitors), middle (converting to leads and qualifying), and bottom (negotiating and closing). In day-to-day operations, the most common breakdown is five stages: visitor, lead, opportunity, proposal, and sale. The right number is the smallest one that still describes how your customer buys.
What is a good sales funnel conversion rate?
It depends on industry, ticket size, and lead source, which is why external benchmarks vary so widely. In B2B SaaS, First Page Sage reports an average of 13% from MQL to SQL and roughly 12% from SQL to closed-won. The most useful reference is your own history: consistent month-over-month improvement matters more than hitting a number from someone else's report.
What's the difference between a sales funnel and a marketing funnel?
The marketing funnel runs from attraction to qualified lead; the sales funnel, from qualified lead to contract. The border is the famous handoff agreement (what counts as an MQL, what counts as an SQL). Without that border in writing, each team grades itself with its own ruler and nobody sees the whole picture.
How do you build a sales funnel in a spreadsheet or CRM?
In a spreadsheet: one row per deal, columns for stage, value, source, and entry date per stage; a pivot table handles the rates. In a CRM, configure the same stages with written criteria and require daily updates from the team. The tool matters less than the discipline: an outdated funnel lies with any technology.
How often should you review the funnel?
Conversion rates: monthly, compared against the previous three to six months. The funnel's structure (stages and criteria): every six months, or whenever the sales process truly changes (new channel, new ticket size, new customer profile). Changing stages constantly destroys the comparability of your history.
A good funnel is one that answers questions
The funnel's value is not in the diagram; it's in the conversation it changes. Instead of "why are we selling so little?", the team starts discussing "why did proposal conversion drop 15 points?". The first question produces opinions; the second produces action. If 62% of companies don't track these rates, the ones that do start the game ahead.
And that tracking doesn't have to be manual. Sherlok connects your CRM, Meta Ads, Google Ads, and GA4 and lets you ask in plain language, "which funnel stage dropped the most this quarter?", and get the analysis ready, with numbers and context. The funnel becomes an analyst available around the clock, not a spreadsheet someone has to remember to update.
Sources cited: RD Station Panoramas 2026 (via Meio & Mensagem) and First Page Sage benchmarks compiled by Understory.
Your AI agents already know what to do in your account.
Turn them on free, no credit card.
- No credit card
- Read-only access
- Revoke it any time