
NPS: how to calculate, read and act on the score
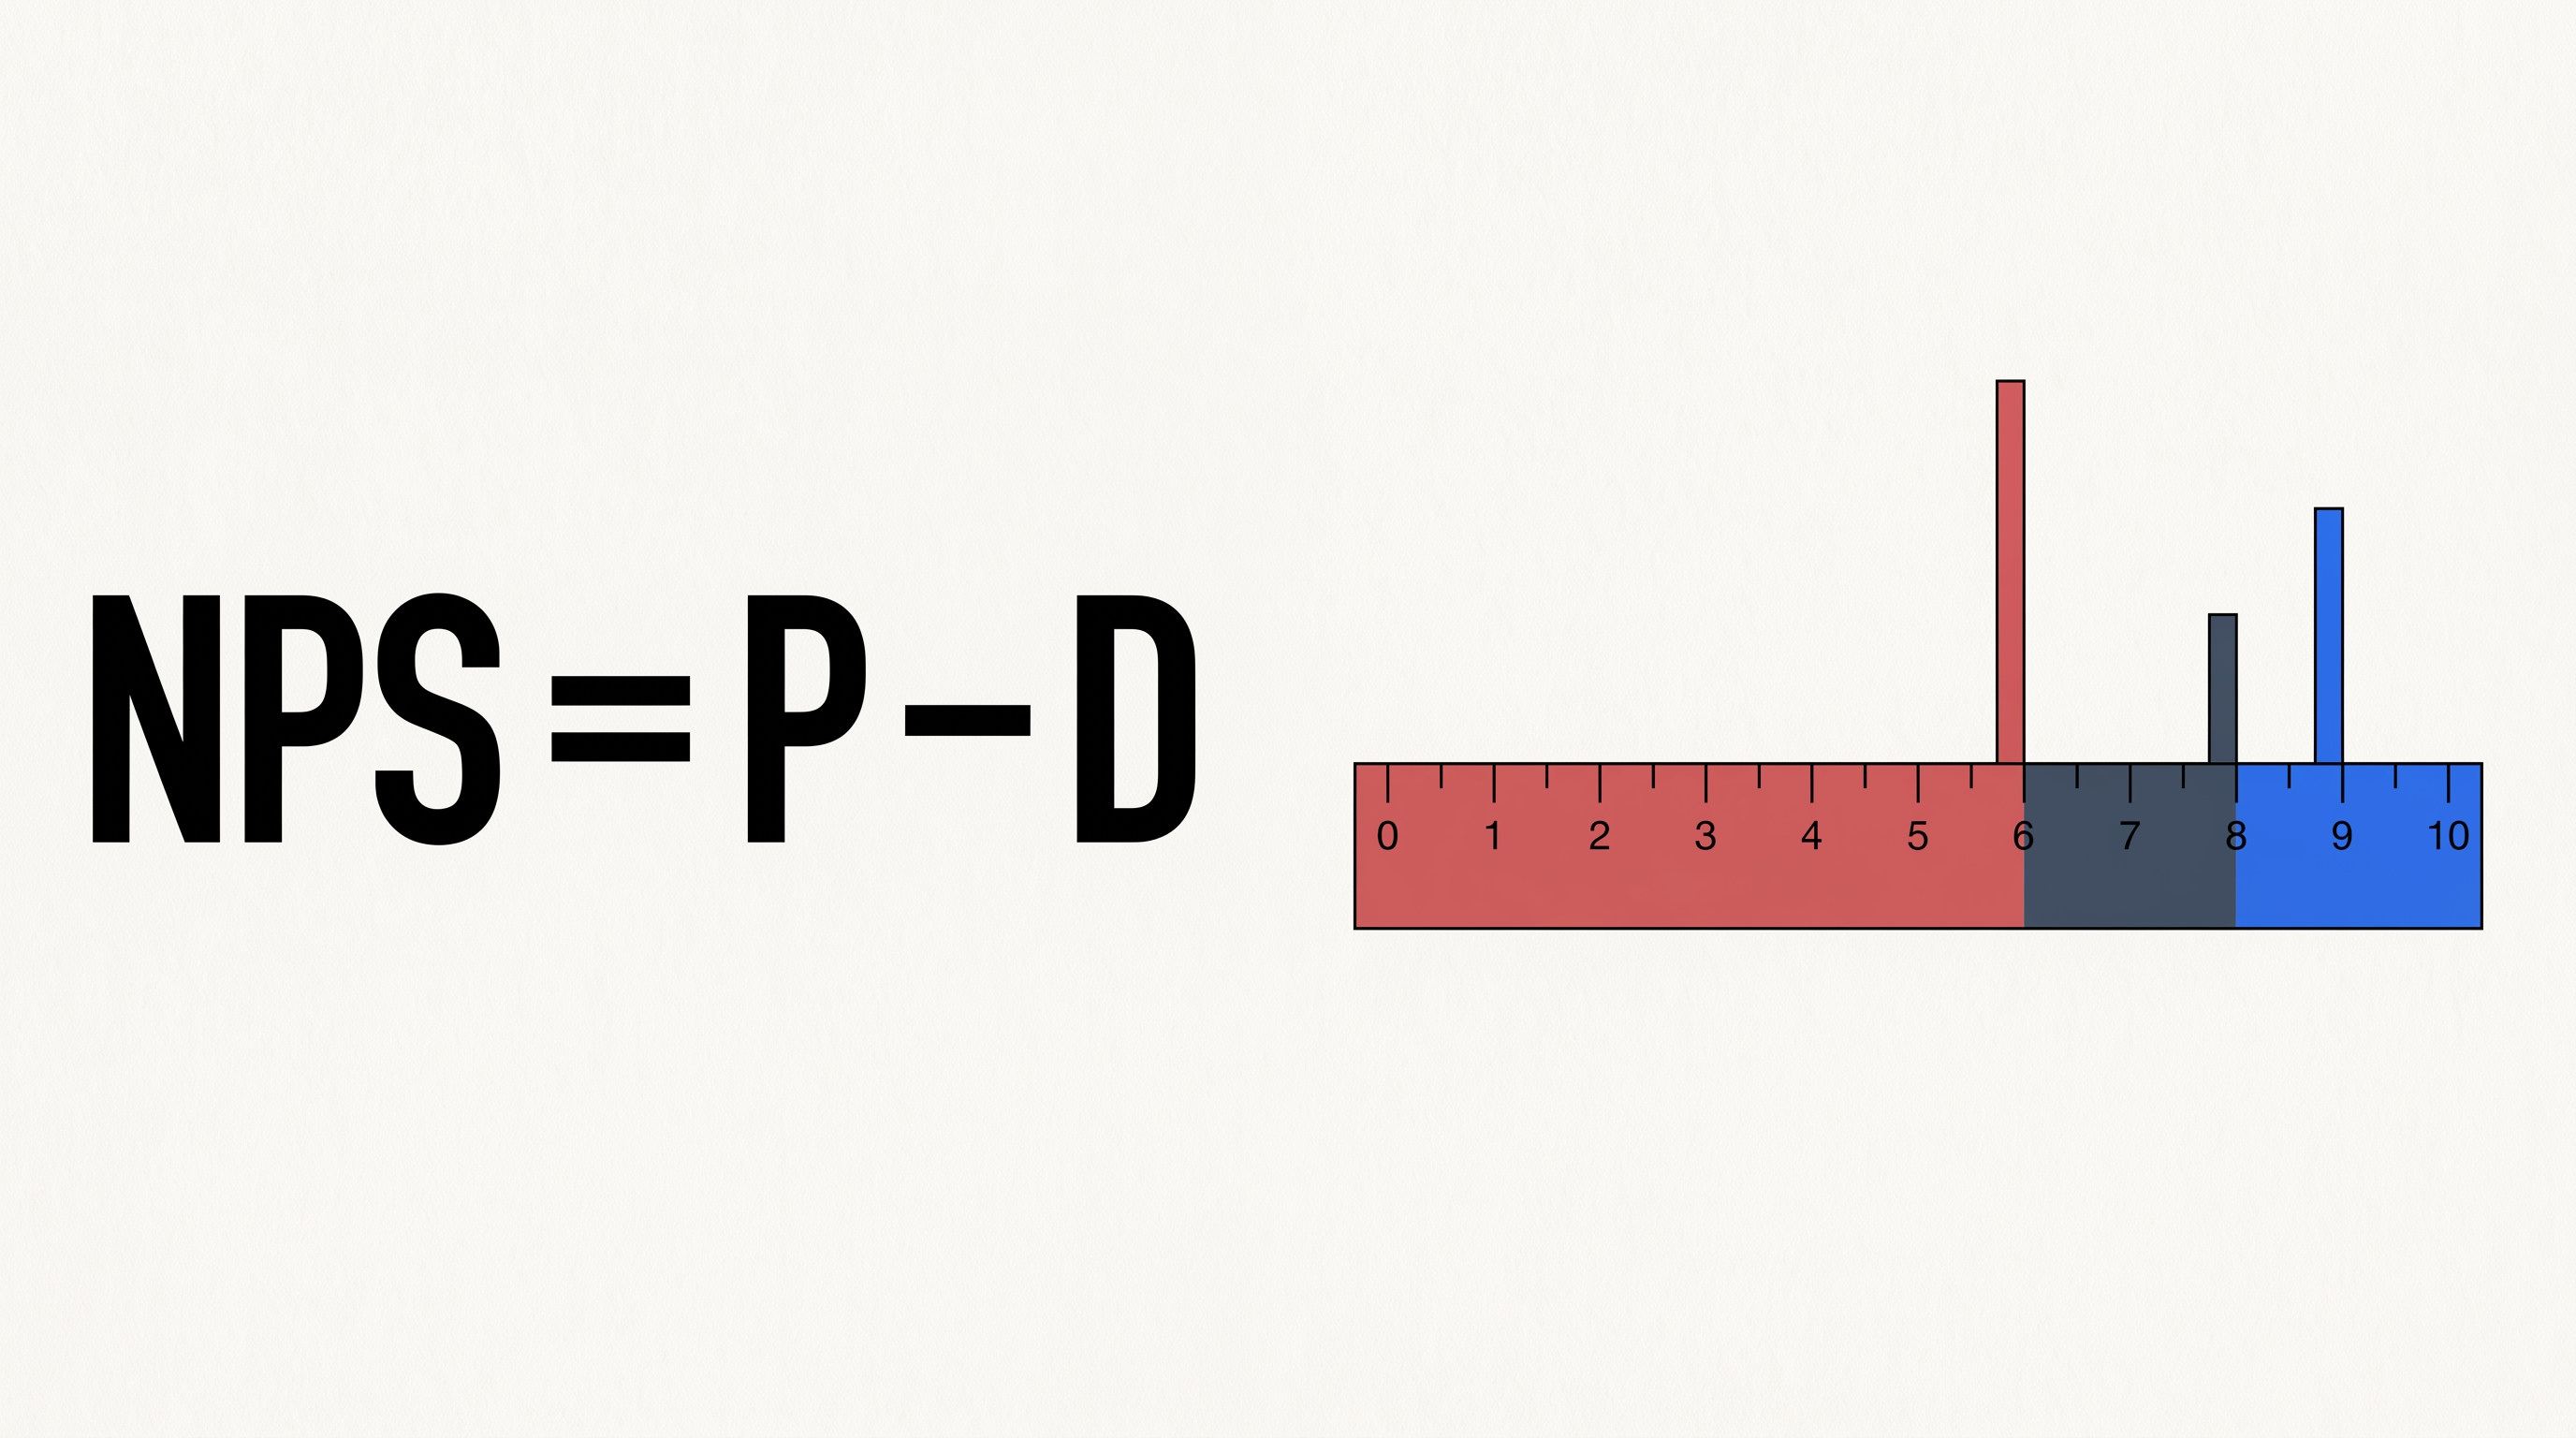
The quarterly review opened with the NPS: 62. There was applause. Four slides later, the customer success team showed churn had climbed for the second quarter running. Nobody connected the two, and 62 stayed proudly on the following month's deck.
That scene repeats because NPS is easy to calculate and hard to use. The arithmetic fits on one line. The interpretation does not. And the part that actually changes something, deciding what to do with the result, rarely makes it into the report.
What is NPS and how do you calculate it?
NPS (Net Promoter Score) measures the gap between promoters and detractors in a 0-to-10 survey. Promoters answer 9 or 10, passives answer 7 or 8, detractors answer 0 through 6. The formula is: NPS = % of promoters minus % of detractors. The result ranges from -100 to 100 and is not a percentage.
Four steps:
- Ask a single question: "on a scale of 0 to 10, how likely are you to recommend us to a friend or colleague?"
- Sort every answer into promoter (9-10), passive (7-8) or detractor (0-6).
- Calculate the share of promoters and the share of detractors against the total number of responses, passives included.
- Subtract one from the other and round to the nearest whole number.
A worked example. A software company sends the survey and gets 400 responses: 210 people answered 9 or 10, 120 answered 7 or 8, and 70 answered somewhere between 0 and 6.
- Promoters: 210 ÷ 400 = 52.5%
- Detractors: 70 ÷ 400 = 17.5%
- NPS = 52.5 − 17.5 = 35
Notice what happens to the 120 passives: they drag the score down by occupying space in the base, yet they appear nowhere in the formula. Hold on to that detail, because it explains most of the misreadings further down.
What counts as a good NPS?
Most teams use a four-band classification. Treat it as a starting reference, not a verdict.
| Range | Zone | What it means in practice |
|---|---|---|
| -100 to 0 | Critical | More people speak badly of you than well. The problem is product or delivery, not the survey. |
| 1 to 50 | Improvement | It works but it does not delight. Most companies live here. |
| 51 to 75 | Quality | A solid promoter base. Referral becomes a usable acquisition channel. |
| 76 to 100 | Excellence | Rare. Usually comes from a small niche with hands-on service. |
Here is what the zone tables hide: industry matters more than the band. The 2026 NPS Benchmarking by Opinion Box, which gathered roughly 590,000 ratings of 642 brands across 50 segments between December 2025 and February 2026, puts home décor and household goods on top with an average NPS of 75, while telecom and broadband closes the list at 30.
So a 45 at a telecom carrier is above the industry average. The same 45 at a home décor retailer is a warning sign. Comparing your number against a generic global average tells you nothing useful. Comparing it against your segment and your own history does.
Where the math breaks down
NPS has well-known blind spots. Worth listing them before you put the metric on somebody's bonus.
The score hides the distribution
Two companies can both land on 40 with completely different bases. One with few detractors and a wall of indifference; the other with plenty of promoters and plenty of detractors at once. Their action plans have nothing in common, but the dashboard shows the same number.
The sample is usually too small
At 40 responses, every single person is worth 2.5 points of NPS. Three more detractors and the indicator drops 7.5 points without anything changing in your product. A good share of the swings celebrated or mourned in monthly meetings is small-sample noise. Below 100 responses per cut, treat movement with suspicion.
The people who answer are not the people you need to hear
An open email survey attracts two profiles: the delighted customer and the furious one. The large middle block, which is the majority and is exactly who cancels quietly, barely responds. That tends to inflate the score in operations with good service and sink it in operations with a recent incident.
Timing changes the answer
Transactional NPS, fired right after a support interaction, measures that interaction. Relational NPS, sent every six months to the whole base, measures the relationship. They are different numbers, they measure different things, and they should not be compared. Pick one as the official indicator and say which.
What to do with the result
An isolated number does not produce a decision. Crossing it with the rest of the operation does. In practice, four moves deliver more than any increase in survey frequency.
Read the open-ended answer. The "why?" field right after the score is worth more than the score. That is where the three or four recurring causes behind your detractors show up. Group responses by theme and sort by frequency.
Segment before concluding. An overall NPS of 35 might be 55 on the annual plan and 12 on the monthly one. It might be 60 among customers past their first year and 15 among those who joined last quarter. Cutting by plan, acquisition channel, region, tenure and account owner is where the insight lives.
Cross it with churn and revenue. This is the check almost nobody runs and the one that turns NPS into a business metric. Take the detractors from the last six months and compute that group's churn rate against the promoters'. If the gap is small, your NPS is not predicting anything and the survey needs rethinking. If it is large, you just gained a leading revenue indicator and can estimate the impact on LTV for each band.
Close the loop on a deadline. Every detractor scoring 0 to 6 should trigger a contact within 48 hours. Not to sell, to understand. Companies that do this tend to recover part of the base before cancellation and find product problems months ahead of support.
All of that depends on having survey responses sitting in the same place as billing, usage and channel data. That is where most teams stall: the survey lives in a form tool, cancellations in the CRM, revenue in the finance spreadsheet. Sherlok keeps those sources connected and lets you ask in plain language, something like "what is the NPS of customers who cancelled last quarter?", and get the answer instead of filing a report request. If you want more angles to cut by, our list of questions for data analysis has examples by department.
Why this shows up in revenue
The link between experience and money is not abstract. In Opinion Box's Consumer Trends 2026, 62% of Brazilian consumers said they had already abandoned a purchase because of a bad experience, and 59% said they would rather pay more for a good one.
Translated to your spreadsheet: every detractor is revenue walking out without complaining, and every promoter is an acquisition channel that never hits your media budget. If you track SaaS metrics or retention, segmented NPS belongs right next to churn, not on a separate "satisfaction" slide.
Frequently asked questions
How do you calculate NPS in Excel?
With the scores in one column, use three formulas: =COUNTIF(A:A,">=9") for promoters, =COUNTIF(A:A,"<=6") for detractors and =COUNTA(A:A) for the total. Then apply (promoters/total − detractors/total) × 100 and round with ROUND.
Can you calculate NPS on a 1-to-5 scale?
Not properly. NPS is defined on a 0-to-10 scale, and folding it into five points changes the proportion between the groups. If you already collect 1 to 5, the honest move is to call it CSAT, and to switch the question's scale if you want real NPS. Comparing the two is comparing different things.
How many responses do I need for NPS to be reliable?
There is no magic number, but below 100 responses per cut the margin of error gets too wide to support a decision. A practical rule: if your NPS swings more than three or four responses would move it, the sample is the problem, not the customer.
Is NPS a percentage?
No. It is an index running from -100 to 100. Saying "an NPS of 42%" is a common mistake. The correct phrasing is "an NPS of 42 points", because the value is the difference between two percentages, not a percentage itself.
How often should I measure NPS?
Depends on the type. Relational works well every six months, or quarterly on large bases, so you do not exhaust customers. Transactional fires on the event: right after support, delivery or onboarding. Running the relational survey monthly tends to produce survey fatigue and falling response rates.
The number is not the goal
A high NPS is not an achievement, it is a symptom. The value of the indicator is in pointing at where to look, not in decorating the boardroom table. Companies that use NPS well tend to talk very little about the number and a great deal about the three reasons detractors keep repeating, because that is where the next product fix comes from.
If reaching that level of reading means exporting three systems and joining them by hand, your bottleneck is not the metric, it is access to the data. Connecting survey, CRM and billing in one place turns "what was our NPS?" into "which customers turned detractor and how much revenue do they represent?", which is the question that changes the meeting.
Your AI agents already know what to do in your account.
Turn them on free, no credit card.
- No credit card
- Read-only access
- Revoke it any time