ROI vs ROAS: The Difference and When to Use Each
A fashion store books $40,000 in sales from $10,000 in ads. ROAS of 4. The media buyer celebrates in the group chat, the owner forwards the screenshot to a partner, and at the end of the month the books close in the red. Nobody lied: the ROAS really was 4. The problem is that ROAS doesn't measure profit, and that confusion quietly drains cash from advertisers every single month.
The difference between ROI and ROAS is easy to state: ROAS measures how much revenue each dollar of ad spend generated (revenue ÷ ad spend), while ROI measures how much profit was left after all costs ((profit − total investment) ÷ total investment). ROAS evaluates campaigns; ROI tells you whether the business actually made money.
The rest of this piece does one thing: show, with real arithmetic, when these two metrics tell opposite stories, and which one you should listen to for each decision.
What ROAS measures (and what it ignores)
ROAS is Return on Ad Spend: revenue attributed to your ads divided by what you paid for them. Spend $10,000, generate $40,000 in tracked sales, and your ROAS is 4 (or 400%). It's the native metric in Meta Ads Manager and Google Ads, which is why it becomes the most-watched number in the operation: it's right there, updated, on the first screen.
What ROAS ignores is everything that happens after the click: cost of goods, taxes, shipping, payment processing fees, packaging, payroll. To the ad platform, a $200 sale at a 60% margin and one at a 12% margin are worth exactly the same. And there's a second blind spot that gets less attention: ROAS depends on attribution. The window and model the platform uses change the number: the same operation can show a ROAS of 6 in Ads Manager and 3.5 in GA4. We've covered this in paid traffic metrics: which to track and which to ignore.
What ROI measures differently
ROI is Return on Investment: (profit − investment) ÷ investment. The key word is profit. Cost of goods, taxes, shipping, fees, and operations all enter the equation, not just the media budget. That's why ROI answers the question ROAS can't reach: was it worth it?
An ROI of 0.4 (or 40%) means every dollar invested came back with 40 cents of profit attached. A negative ROI means the operation paid for the privilege of selling. That simple. And precisely because it's a profit calculation, ROI is slower and more tedious to compute: it needs data that doesn't live in the ads dashboard, but in the ERP, the cost spreadsheet, the finance system.
When a high ROAS hides a loss: the full math
Back to the fashion store. $40,000 in revenue on $10,000 of ad spend, ROAS of 4. Now open up the costs, line by line:
| Line item | Amount | % of revenue |
|---|---|---|
| Revenue attributed to ads | $40,000 | 100% |
| Cost of goods sold (COGS) | − $20,000 | 50% |
| Sales taxes | − $4,000 | 10% |
| Payment processing fees | − $2,000 | 5% |
| Subsidized shipping + packaging | − $3,600 | 9% |
| Allocated operations (staff, tools) | − $1,500 | 3.75% |
| Margin before media | $8,900 | 22.25% |
| Ad spend | − $10,000 | 25% |
| Bottom line | − $1,100 | ROI of −11% |
ROAS of 4, a $1,100 loss. The explanation is the break-even ROAS: with a 22.25% contribution margin, this store only clears zero above a ROAS of 1 ÷ 0.2225 ≈ 4.5. The "excellent ROAS 4" in the report was actually below the operation's break-even point. It's the kind of math almost nobody does because the data lives in different systems, revenue in Ads Manager, costs in the ERP.
Now flip the scenario. A B2B consultancy invests the same $10,000 and closes $20,000 in contracts. ROAS of 2, a number that would make plenty of e-commerce managers pause the campaign. But the service margin is 70%: $14,000 left over, minus the $10,000 in media, $4,000 in profit. ROI of 40%. The "bad ROAS" was a great business.
In practice, this is why comparing ROAS across companies rarely works: a ROAS of 4 can mean a loss in fashion retail and comfortable profit in digital products. The number only means something in light of the advertiser's margin.
Why do so many companies only look at ROAS?
Because it's easy, and ROI takes work. ROAS is served ready-made by the platform; ROI requires bringing media, ERP, and finance data into the same calculation. With digital ad spend in Brazil reaching R$ 42.7 billion in 2025, up 12.7% according to IAB Brasil, deciding budgets on the most convenient metric alone is an expensive risk anywhere in the world.
There's also an incentive bias nobody likes to admit: agencies and media buyers are evaluated on (and sell themselves by) ROAS, because it's the number their tool controls. It's not bad faith, it's the indicator within arm's reach. But whoever answers for the cash flow can't stop there. And conditions are tightening: an analysis by Upcounting puts average e-commerce ROAS at around 2.87 in 2025, citing a median of just 2.04 in 2024 from Triple Whale's data. With average ROAS at that level and margins under pressure, the difference between profit and loss is decided precisely in the costs ROAS can't see.
Which metric should you use for each decision?
It's not ROI or ROAS: it's each in its own lane. A practical guide:
| Decision | Primary metric | Why |
|---|---|---|
| Comparing creatives and audiences within a campaign | ROAS (with CPA as support) | Business costs are identical across ads; what varies is media efficiency |
| Setting spend ceilings and ROAS targets | Break-even ROAS, derived from margin | Without knowing your margin, any ROAS target is a guess |
| Deciding whether a channel stays in the budget | ROI | A channel that sells without profiting is an expense disguised as a result |
| Evaluating the business each quarter | ROI, alongside CAC and LTV | In recurring-revenue businesses, acquisition profit shows up over time, not in the first sale |
That last point deserves emphasis. In repeat-purchase or subscription businesses, ROI calculated on the first sale alone understates the real return: the customer who lost you money at the door may be profitable over the year. That's why ROI lives alongside CAC and LTV, no single metric closes the books by itself.
Frequently asked questions
Are ROI and ROAS the same thing?
No. ROAS compares ad-attributed revenue with ad spend; ROI compares profit with total investment. An operation can have a high ROAS and a negative ROI at the same time; it just takes a margin thinner than the ROAS suggests.
What are the ROI and ROAS formulas?
ROAS = attributed revenue ÷ ad spend. ROI = (profit − total investment) ÷ total investment. ROAS is usually expressed as a multiple (e.g., 4) and ROI as a percentage (e.g., 40%).
What is a good ROAS?
It depends on your contribution margin. Break-even is 1 ÷ margin: at a 25% margin, break-even is a ROAS of 4; at 50%, it's 2. A "good ROAS" is any number comfortably above your own break-even point, not your neighbor's benchmark.
ROI, ROAS, and CPA: which should I use?
CPA (cost per acquisition) is for optimizing inside the campaign, ROAS for comparing media efficiency across campaigns and channels, and ROI for budget decisions and evaluating business results. They complement each other at different levels of decision-making.
Can I calculate ROI directly in Google Ads or Meta?
Not fully. The platforms know revenue and ad spend, but not your product costs, taxes, or operating expenses. Getting to ROI requires crossing ad data with your ERP, spreadsheets, or finance system, outside the platform.
The reading that changes decisions
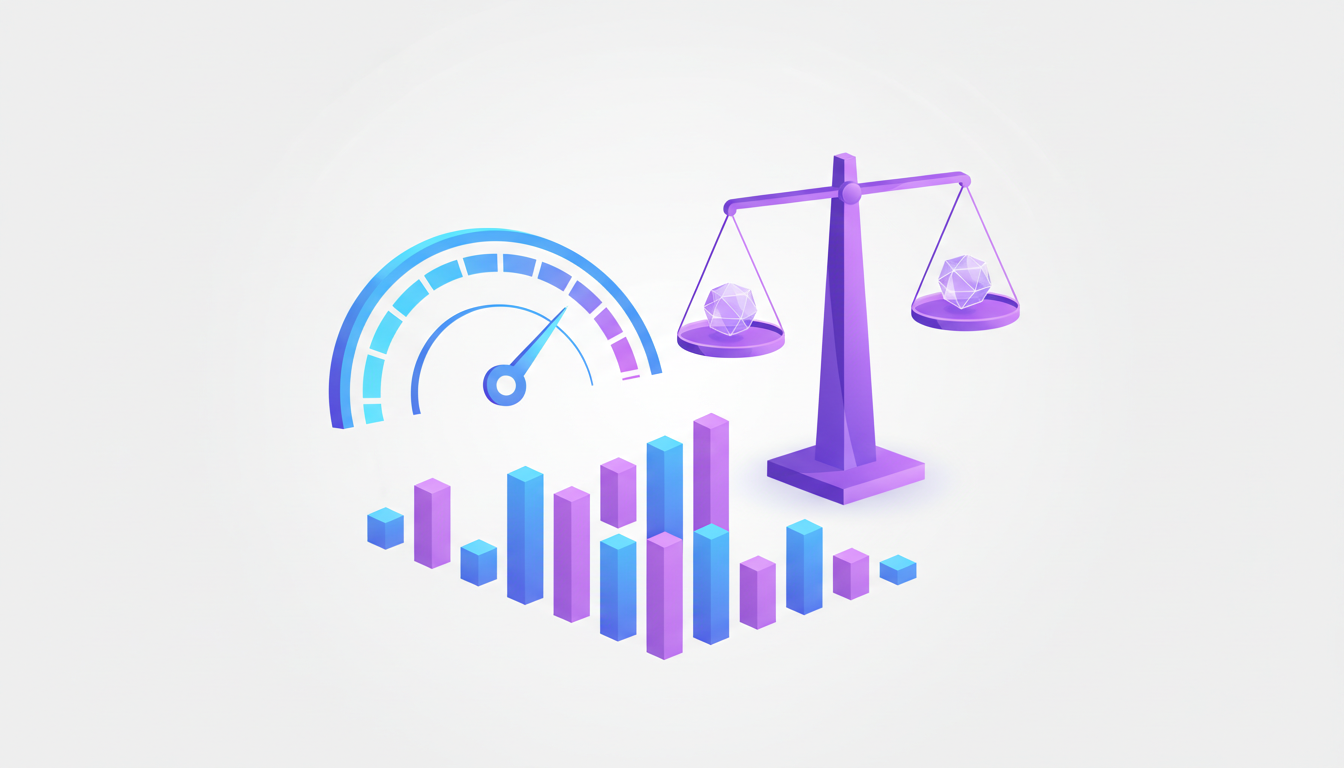
ROAS is the speedometer: it tells you the campaign is moving. ROI is the bank statement: it tells you the trip was worth it. Mature teams don't pick one of the two, they set a break-even ROAS from their real margin, watch ROAS daily, and close the month on ROI. The bottleneck was never the formula; it's having cost, revenue, and media at the same table before the budget meeting, not a week after.
That crossing is exactly what Sherlok automates: by connecting Meta Ads, Google Ads, GA4, cost spreadsheets, and your CRM, you ask a plain-language question ("what was my ROI by channel last month?") and get the analysis ready, with margin already in the math. ROAS stays on the dashboard; decisions start being made on profit.
Your AI agents already know what to do in your account.
Turn them on free, no credit card.
- No credit card
- Read-only access
- Revoke it any time