
Customer segmentation: how to do it in practice (with RFM)
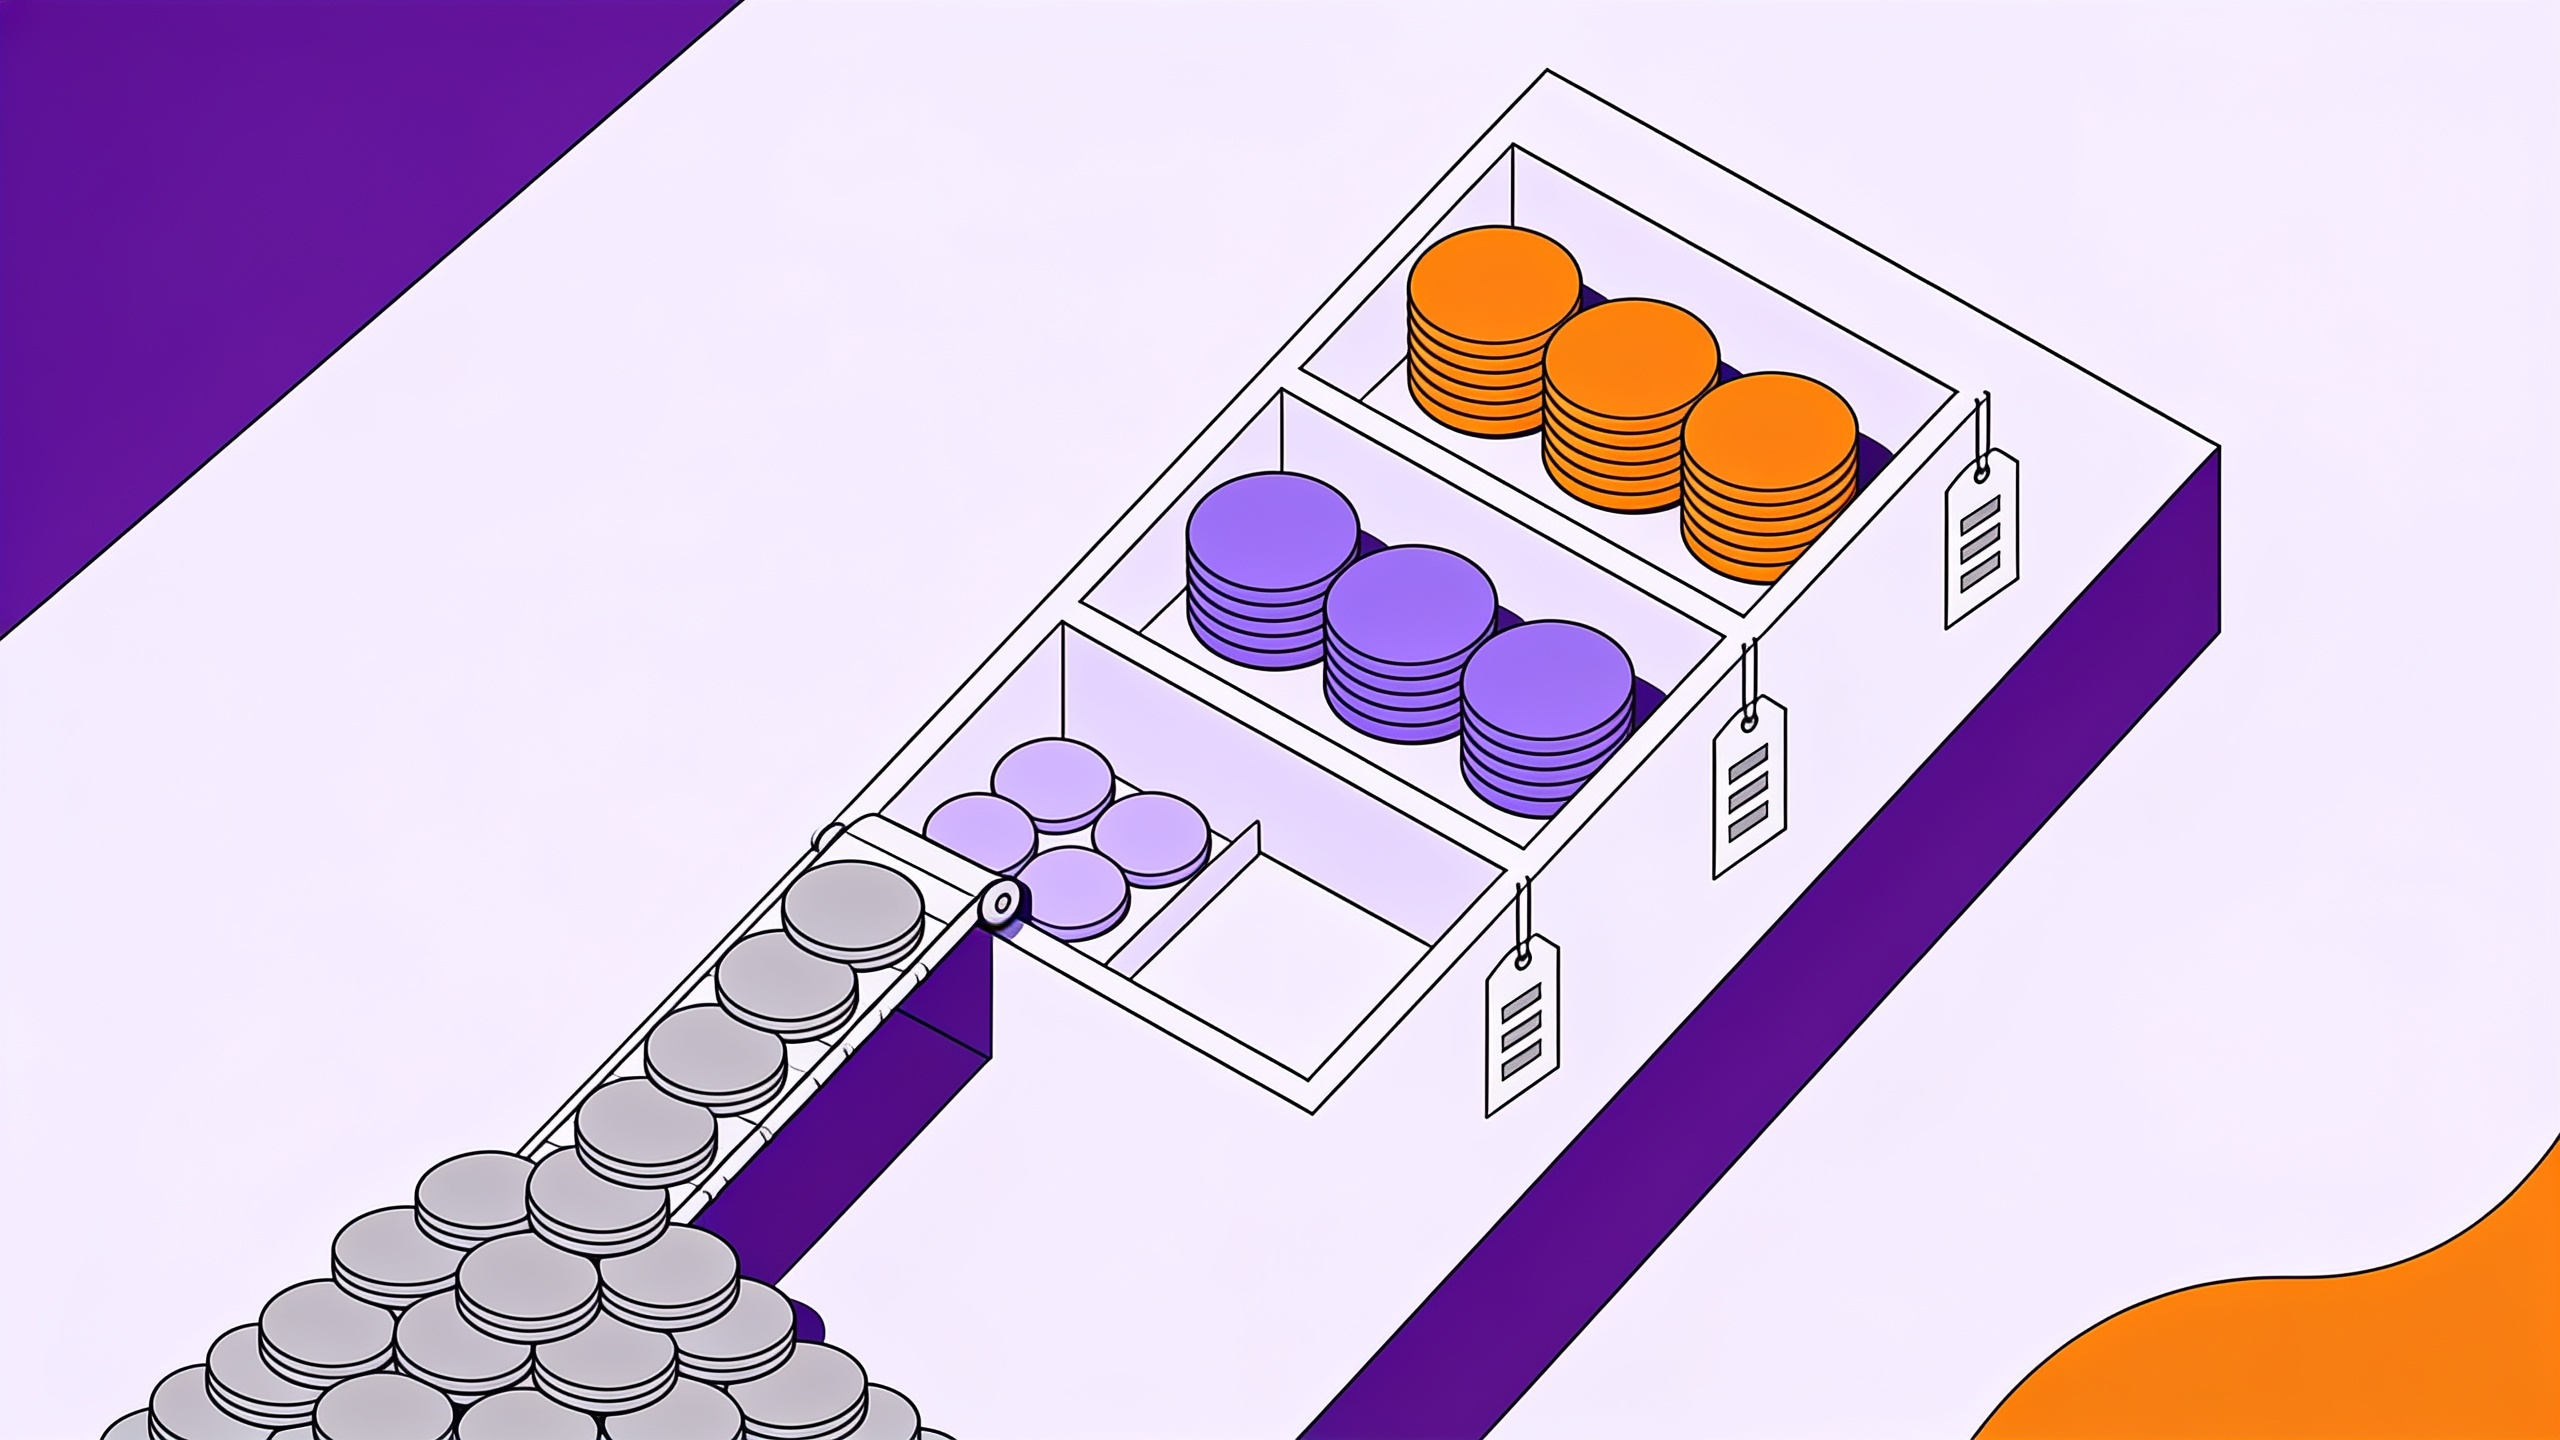
Your store sends the same 15%-off email to the customer who bought nine times this year and to someone who bought once in 2025 and never came back. The first one would have bought anyway. The second probably won’t even open it. You paid a discount to one and got ignored by the other.
That is the quiet cost of treating your whole customer base as a single block. And here is the odd part: almost every company believes it knows its customers well. In Twilio’s 2025 State of Customer Engagement report, 83% of business leaders said they deeply understand their customers. On the other side, only 45% of consumers said they feel understood by brands.
The good news: closing much of that gap doesn’t require a data scientist or an expensive tool. It requires the order list already sitting in your e-commerce platform, ERP or CRM, plus a simple method called RFM.
How to do customer segmentation in practice: take the last 12 months of order history and calculate, for each customer, how many days since their last purchase (recency), how many purchases they made (frequency) and how much they spent (monetary value). Score each dimension from 1 to 5, group the combinations into segments and assign a different action to each group.
What is customer segmentation and why start with RFM?
Segmenting means splitting your base into groups that deserve different treatment. There are four classic criteria: demographic (age, income), geographic (city, region), psychographic (lifestyle, values) and behavioral (what the person actually did with your company).
For most small and mid-sized businesses, behavioral is the best place to start for a practical reason: it is the only data you already have, complete and reliable. Demographic data usually comes from half-filled sign-up forms. Psychographic data requires surveys. Orders, on the other hand, are recorded with a date and an amount, because without that nobody gets paid.
RFM is the leanest form of behavioral segmentation. It rests on an old direct-marketing observation: people who bought recently, buy often and spend more tend to respond better to the next offer. No algorithm involved. Just three calculations per customer.
- Recency (R): days since the last purchase. Lower is better.
- Frequency (F): number of orders in the period.
- Monetary value (M): total spent in the period.
How to do RFM segmentation in 4 steps
Step 1: pull the last 12 months of orders
You need three columns: a customer identifier (email, tax ID or customer ID), order date and order value. Export it from Shopify, WooCommerce, your POS or your CRM. Twelve months is a good window if customers repurchase monthly or quarterly. If your cycle is long (furniture, electronics), use 24 months.
Two checks before you calculate. First, remove cancelled and returned orders, or the customer who returned everything becomes “frequent.” Second, merge duplicate customers: the same person with two email addresses becomes two rows and nobody notices. This kind of silent error shows up in almost every dataset that hasn’t been cleaned.
Step 2: calculate R, F and M for each customer
Pick a reference date (say, September 30, 2026). For each customer, recency is that date minus the date of the last order; frequency is the order count; monetary value is the sum. In a spreadsheet, a pivot table with MAX of date, COUNT of orders and SUM of value does the job.
Step 3: turn the numbers into 1-to-5 scores
The textbook way is to split each dimension into quintiles: the top 20% get a 5, the next 20% get a 4, and so on. It works well for recency and monetary value.
For frequency, quintiles almost always break. It is common for most of the base to have bought only once, so half your customers tie on the same number and the quintile stops meaning anything. In practice, use fixed ranges that make sense for your business. Here is an example for an online cosmetics store (values in Brazilian reais):
| Score | Recency (days) | Frequency (orders) | Value (R$ over 12 months) |
|---|---|---|---|
| 5 | up to 20 | 6 or more | 1,500 or more |
| 4 | 21 to 60 | 4 to 5 | 800 to 1,499 |
| 3 | 61 to 120 | 3 | 400 to 799 |
| 2 | 121 to 210 | 2 | 150 to 399 |
| 1 | over 210 | 1 | under 150 |
A rule of thumb for calibrating recency: a score of 5 should fit within your typical time between purchases. If your repeat purchase rate shows that returning customers usually come back within 30 days, someone at 90 days without buying is already late.
Step 4: group the scores into segments
Three scores from 1 to 5 give you 125 combinations. Nobody can run 125 campaigns. The most common shortcut is to cross only recency and frequency in a 5x5 map and use monetary value as a tiebreaker inside each group.
The rules behind that map, spelled out:
| Segment | Rule | What to do |
|---|---|---|
| Champions | R 4-5 and F 4-5 | Early access, referral program, ask for reviews. Skip the discount: they already buy. |
| New and promising | R 4-5 and F 1-2 | Second-purchase flow. This is where you find out whether the customer stays. |
| Loyal | R 3-5 and F 3, or R 3 and F 4-5 | Cross-sell and content. Grow basket size, not frequency. |
| Hibernating | R 2-3 and F 1-2 | Low-cost campaign (email, WhatsApp) with a concrete reason to return. |
| At risk | R 1-2 and F 3-5 | Top priority. Personal outreach and a win-back offer. |
| Lost | R 1 and F 1-2 | One last attempt, then stop spending ad money on them. |
Worked example: six customers of a cosmetics store
Applying the score ranges above, with a reference date of September 30, 2026:
| Customer | Last purchase | Orders | Spent | R-F-M | Segment |
|---|---|---|---|---|---|
| Ana | 12 days ago | 9 | R$ 2,340 | 5-5-5 | Champions |
| Elisa | 45 days ago | 4 | R$ 760 | 4-4-3 | Champions |
| Bruno | 25 days ago | 2 | R$ 310 | 4-2-2 | New and promising |
| Fábio | 8 days ago | 1 | R$ 1,200 | 5-1-4 | New and promising |
| Carla | 140 days ago | 7 | R$ 1,980 | 2-5-5 | At risk |
| Diego | 300 days ago | 1 | R$ 89 | 1-1-1 | Lost |
Notice three things a base-wide average would never show you.
Carla is the most valuable customer the store is losing. She spent almost as much as Ana, yet she hasn’t bought in 140 days. In a generic email flow she gets the same message as Diego. With RFM she becomes the first phone call of the week.
Fábio and Bruno sit in the same segment, but M tells them apart. Fábio’s first order was R$ 1,200, which hints at a high-spending profile. He deserves more careful outreach than the standard second-purchase coupon.
Diego costs money if he stays in your retargeting audiences. Excluding lost customers from paid media is often the fastest saving RFM delivers.
RFM in brick-and-mortar retail vs e-commerce: what changes?
In e-commerce the challenge is technical: the data is all there, but scattered across the store platform, the payment gateway and the email tool. The bottleneck is almost always joining the three with the same customer identifier.
In physical retail it is the opposite: the data doesn’t exist unless the customer identifies themselves at checkout. Stores with a loyalty or cashback program that captures an ID at the register can build RFM. Those without one can only segment the share of customers who buy online or through messaging. If you run physical stores, your first segmentation project is probably getting customers to identify themselves, not analysis.
Businesses with rare purchases (mattresses, cars, expensive courses) also need an adjustment. Frequency barely varies, so RFM effectively becomes “RM.” In those cases, pair it with cohort analysis to understand behavior by customer cohort.
Where RFM segmentation falls short (and how to avoid it)
It looks backward. RFM describes what a customer did, not what they will do. A new high-ticket customer like Fábio may become a champion or vanish. To predict, you need propensity or LTV models, which come later.
It ignores margin. A customer who spends R$ 2,000 only on sale items may be worth less than one who spends R$ 900 on full-margin products. If you have per-product cost, swap revenue for contribution margin in the M column.
It goes stale fast. A segmentation done once and left in a spreadsheet becomes an old photo. RFM’s value is in the movement: how many customers moved from “Loyal” to “At risk” this month? That number is a churn warning before churn shows up in revenue.
The most common mistake isn’t technical. It is building the segments and then sending the same campaign to everyone. If each segment doesn’t have an action, an owner and a success metric, the analysis was just an exercise.
Frequently asked questions
What is customer segmentation?
It is dividing your customer base into groups with similar traits or behaviors so you can treat each group differently. The most common criteria are demographic, geographic, psychographic and behavioral. RFM is a type of behavioral segmentation based on purchase history.
What are the 4 types of customer segmentation?
Demographic (age, gender, income), geographic (country, city, region), psychographic (values, lifestyle, interests) and behavioral (purchases, usage, engagement). For smaller businesses, behavioral is usually the most useful because it relies on data the company already records.
How do I do customer segmentation in Excel?
Export orders with customer, date and value. Build a pivot table per customer with the max date, order count and sum of value. Calculate days since the last purchase, assign scores with IF or VLOOKUP against a ranges table, and concatenate the scores into an R-F-M code.
What is the difference between RFM and cohort analysis?
RFM classifies each customer today based on what they have done. Cohort analysis groups customers by when they joined and tracks how each cohort behaves over the months. One answers “who should I treat differently right now”; the other, “is our retention improving.”
How often should I update RFM segmentation?
Monthly is a good default for most e-commerce and retail businesses. Very fast repurchase businesses, like food delivery and pharmacies, benefit from weekly updates. What matters most is comparing month over month and looking at who changed segments.
Segmenting means deciding who won’t get the campaign
The real payoff of RFM isn’t a pretty six-color spreadsheet. It is the nerve to send less: fewer discounts to people who would buy anyway, less ad spend on people who have already left, more attention for Carla before she turns into Diego. Teams that do this every month start seeing churn coming instead of discovering it at month-end close.
If building and refreshing this table every month sounds like too much work, Sherlok connects your e-commerce, CRM and spreadsheets and lets you ask plain questions, such as “which customers who used to buy every month have stopped?”, and get the list and the analysis ready to use.
Your AI agents already know what to do in your account.
Turn them on free, no credit card.
- No credit card
- Read-only access
- Revoke it any time