North Star Metric: what it is and examples by business type
Ask five people in your company which number tells you whether the month went well. If you get five different answers (revenue, leads, followers, NPS, margin), you don’t have a dashboard problem. You have a direction problem. Every team is rowing hard, just in different directions.
The North Star Metric exists to fix exactly that. Below you’ll find the short definition, North Star Metric examples by business type (SaaS, ecommerce, agencies, services and marketplaces) and a simple test to pick yours without falling into the usual traps.
A North Star Metric (NSM) is the single indicator that best captures the value customers get from your product and that, as it grows, pulls revenue up with it. It doesn’t replace your other KPIs. It organizes them. Example: for a repeat-purchase online store, "customers with two or more orders in 90 days" says more than monthly revenue.
What is a North Star Metric, in practice?
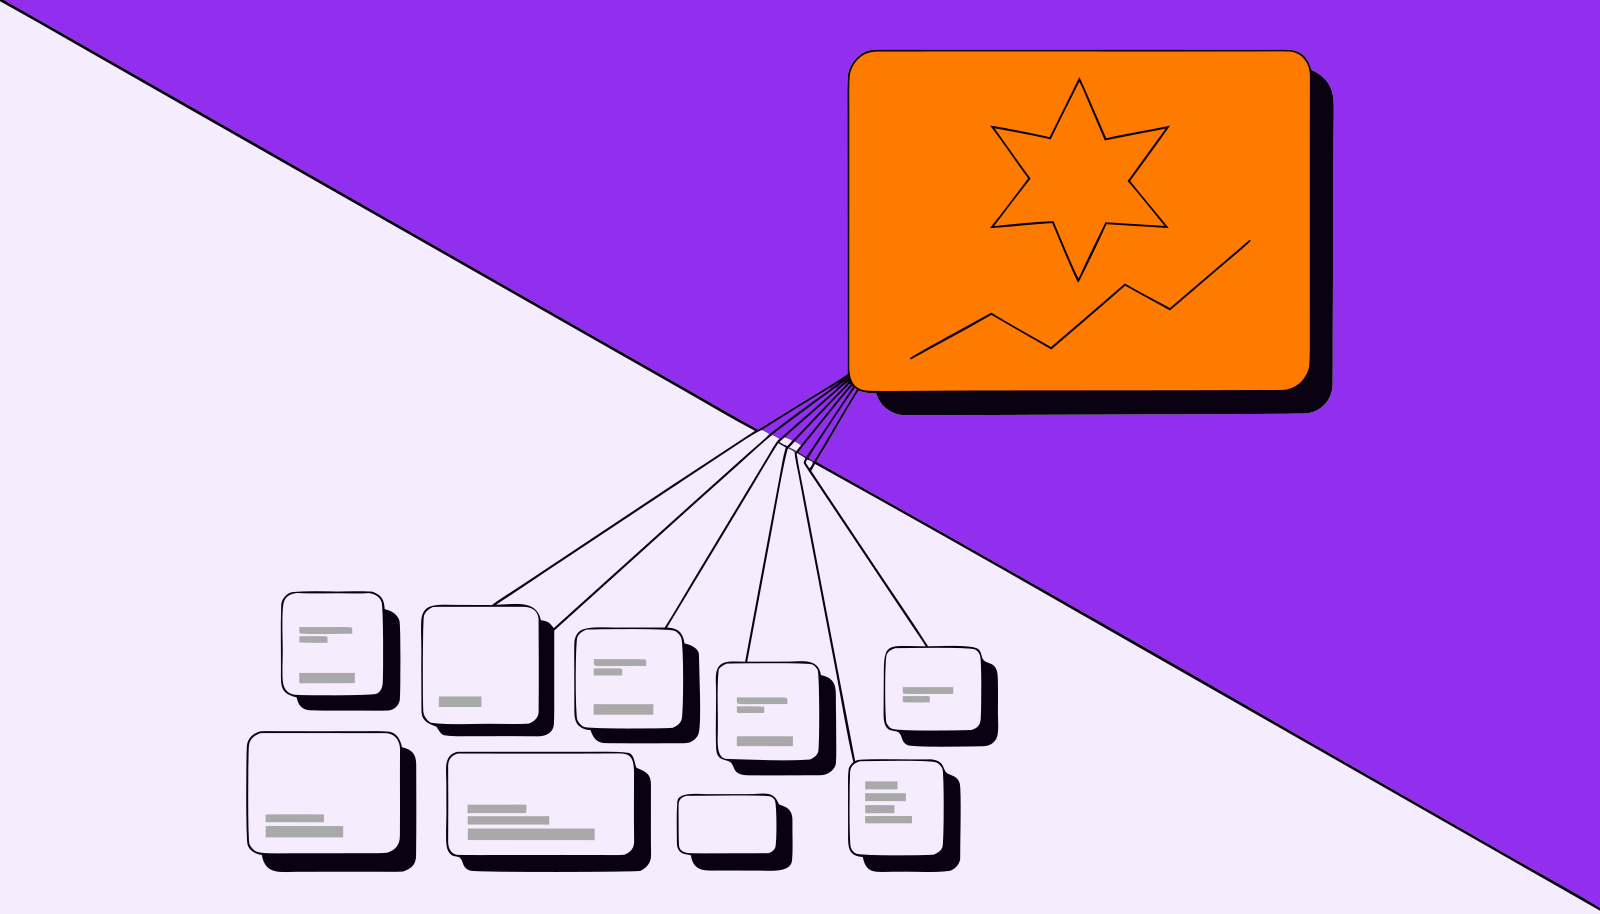
Think of the NSM as the metric at the top of a tree. Below it sit the input metrics, the ones teams can move day to day. Below those are the levers: campaigns, product tweaks, post-purchase routines. When someone pitches a project, the question becomes "does this move our NSM?", and half of the prioritization debates end right there.
Three traits separate an NSM from any other KPI:
- It measures value delivered to the customer, not company effort. "Repeat orders" measures value, while "emails sent" measures effort.
- It leads revenue. It goes up before revenue does. If it only shows up at month-end close, it arrives too late to change course.
- Teams can influence it in short cycles, weeks rather than years.
A common mix-up is treating the NSM as a goal. It’s the metric. The goal is the target you set for it this quarter. If you already run OKRs, the logic will feel familiar: the NSM usually becomes the most important key result of the cycle. If that link is still fuzzy, read the difference between OKRs and KPIs first.
Why revenue doesn’t work as a North Star Metric
This is the objection that comes up most: "what matters is revenue, so revenue is my NSM." The reasoning is understandable and almost always leads to bad decisions.
Revenue is an outcome, not a cause. It blends price, mix, seasonality and discounts. An aggressive Black Friday inflates sales and can hide the fact that your loyal customer base shrank. A well-chosen NSM shows that shrinkage weeks before it hits the income statement.
Recent data helps explain why. Amplitude’s 2025 Product Benchmark Report, which analyzed more than 2,600 companies, found that 69% of the products with the best day-seven activation were also among the top performers in retention three months later. The same study shows that, for half of the products analyzed, more than 98% of new users are no longer active by week two. In other words, the signal that the business is healthy appears early, in usage behavior, long before it turns into recurring revenue. That’s the signal an NSM tries to capture.
North Star Metric examples by business type
The classic cases (nights booked at Airbnb, time spent listening at Spotify) are useful to grasp the concept but don’t help much a 30-person company. The table below has examples closer to what small and mid-sized businesses deal with, plus the reasoning behind each one.
| Business type | Example NSM | Why it works | Common trap |
|---|---|---|---|
| B2B SaaS | Accounts that performed the product’s core action 3+ times in the week | Recurring use of the core feature precedes renewal and upsell | Using "logins" or "signed-up users", which don’t prove value |
| Repeat-purchase ecommerce | Customers with 2+ orders in the last 90 days | Repeat purchase proves the product delivered on its promise | Using total orders, which rise with ad spend even without loyalty |
| One-off purchase ecommerce (furniture, appliances) | Orders delivered on time with no return | Reflects the full experience, which drives referrals and reviews | Measuring site conversion only and ignoring delivery |
| Marketing agency | Clients that hit the agreed monthly target | Clients with results renew and refer | Measuring output (posts, assets, reports) |
| Recurring services (clinic, gym, school) | Active customers who showed up at least X times in the month | Frequency is the best predictor of staying | Looking only at new sign-ups |
| Marketplace | Completed transactions with a positive review | Captures value for both sides at once | Measuring GMV only, which hides buyer-seller friction |
Notice that none of these is "revenue", "followers" or "visits". And all of them have an explicit time window. An NSM without a time window becomes a cumulative number that only goes up and teaches you nothing.
North Star Metric example for SaaS
Practice-management software for dental clinics could track "clinics with 20 or more appointments confirmed through the system in the week". The number is deliberately specific: a clinic confirming 20 appointments a week through the software depends on it to operate and rarely cancels. A clinic that only logs in barely notices if the tool disappears. Subscription businesses can pair this NSM with the SaaS metrics investors look at, such as NRR and churn.
North Star Metric example for ecommerce
Picture a supplements store in Brazil that gets 2,600 new buyers a month, with 14% of them placing a second order within 60 days. That’s 364 new repeat customers a month. If the CRM team pushes that rate to 18%, it becomes 468 customers, 104 more every month. With an average order value of R$ 180 (about US$ 33), the extra second orders alone add roughly R$ 18,700 a month, without a single extra dollar in ads (illustrative simulation).
The NSM "customers with 2+ orders in 90 days" captures that gain. Revenue captures it too, but mixed with everything else. To dig deeper into repeat-purchase dynamics, customer retention rate is the sister metric worth tracking alongside it.
How to choose your North Star Metric
The fastest way I know starts with an uncomfortable question: "which customer behavior shows they got the value we promised?" List three to five candidates and run each one through the filter below.
- Does it reflect customer value? If customers don’t feel any difference when the number goes up, it’s a vanity metric.
- Does it come before revenue? If it only exists after the cash comes in, you’ll use it to explain the past, not to change the future.
- Can the team move it weekly? Annual NPS and market share pass the first two tests and fail here: they’re too slow to steer operations.
Passed all three? Write the NSM in one sentence anyone in the company understands, with the time window spelled out. Then break it down into two to four input metrics and assign a team owner to each.
Signs you picked the wrong NSM
A few warning signs that show up in companies of every size:
- The NSM rises for three months straight while revenue stays flat. The metric is probably measuring activity, not value.
- Nobody outside leadership knows what it is. If it doesn’t show up in weekly meetings, it isn’t guiding anything.
- It’s easy to game. If a deep discount or a mass email makes the number jump without improving the experience, the metric needs a stricter definition.
Changing your NSM isn’t failure. Companies move through stages, and the metric that made sense to validate the product is rarely the one that makes sense to scale. What doesn’t work is switching every quarter: nobody ever learns how to move it.
How to track the NSM day to day
An NSM only works if it’s visible. In practice that means a lean dashboard with the NSM at the top, input metrics right below and a comparison with the previous period. No 40 charts. If you’re building that view now, the digital marketing dashboard guide shows how to organize the information hierarchy.
The bottleneck is usually the data, not the concept. An NSM like "customers with 2+ orders in 90 days" requires joining the ecommerce platform with the CRM, and "clients that hit their target" means combining Meta Ads, Google Ads and GA4 per client. When each number lives in a different tool, the NSM becomes a spreadsheet assembled by hand once a month, and it stops working as a weekly compass.
Frequently asked questions
What’s the difference between a North Star Metric and a KPI?
Every NSM is a KPI, but not every KPI is an NSM. A company has many KPIs, one for each area or funnel stage. The NSM is the single one chosen to represent the core value delivered to customers, and the other KPIs exist to explain it or move it.
Can a company have more than one North Star Metric?
It shouldn’t. Two NSMs bring back the problem the NSM solves: teams prioritizing different things. Companies with very different business units can have one NSM per unit, as long as every team knows exactly which one is theirs.
Can a North Star Metric be a financial metric?
It’s rarely a good idea. Revenue, profit and valuation are consequences of value delivered and react with a lag. The exception is businesses where the customer value itself is financial, like a lending fintech, where "loan volume repaid on time" blends both.
How often should you review your North Star Metric?
Track it every week and question the choice once a year, or when the company changes stage (new product launch, new revenue model, new market). Reviewing it more often keeps the team from learning how to move it.
What is an input metric?
It’s a metric that explains the NSM and that a specific team can move. If the NSM is "customers with 2+ orders in 90 days", input metrics would be new buyers per month, second-order rate and repeat-buyer frequency.
An NSM only matters if someone looks at it
Choosing a North Star Metric takes an afternoon. Keeping it alive, with data joined and refreshed every week, is where most companies give up. Sherlok connects Meta Ads, Google Ads, GA4, your CRM and spreadsheets, so you can ask in plain language "how is our North Star doing this week and what dragged it down?" and get the analysis ready. That takes the metric out of the annual-meeting slide and puts it back where it belongs: the Monday conversation.
Your AI agents already know what to do in your account.
Turn them on free, no credit card.
- No credit card
- Read-only access
- Revoke it any time